
Metros where homes are selling for the most over asking price
Canva
Metros where homes are selling for the most over asking price
The Federal Reserve’s efforts to curb inflation have pushed interest rates to levels not seen for over two decades, and the number of home sales has been on the decline since its pandemic peak.
Homes are still selling, even if slowly. And they’re still increasing in price, though that increase has slowed a bit, too. Some homes are still selling for slightly more than the list price, and sellers continue to have the upper hand in some markets.
Stacker analyzed data from Redfin to see which metros had the most homes sold over the asking price. Data shows sales for May 2023. Metros with fewer than 300 home sales do not appear on this list. Metro areas are ranked on the average sale-to-list ratio—a ratio of sale price divided by list price—for homes that sold in May. Values are rounded to the nearest hundredth. Also listed are the metro area’s median listing prices for homes on the market in May and median sale prices for those homes that sold during that month.
![]()
Canva
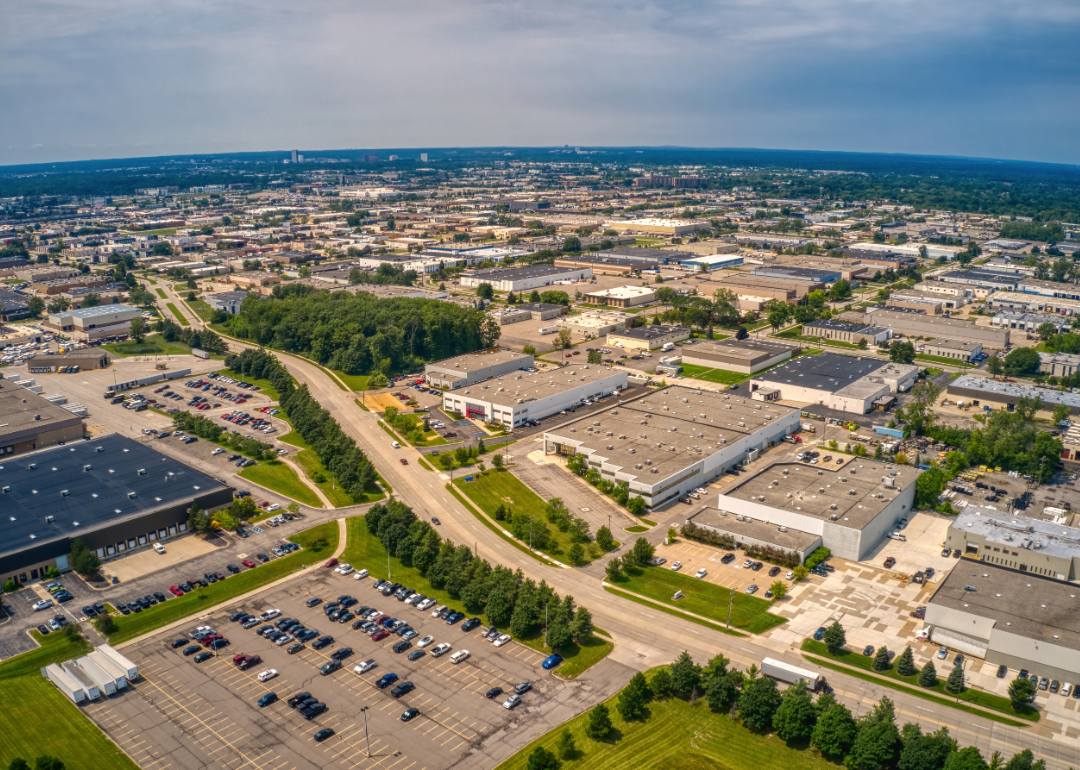
#50. Warren, Michigan
– Average sale to list ratio: 1.01
– Median list price: $310,000
– Median sale price: $300,000
– Total homes sold: 2,894
– Share that sold above list: 51.0%

Strike First // Shutterstock
#49. Los Angeles, California
– Average sale to list ratio: 1.01
– Median list price: $899,000
– Median sale price: $844,250
– Total homes sold: 4,666
– Share that sold above list: 50.9%

Always Wanderlust / Shutterstock
#48. Olympia, Washington
– Average sale to list ratio: 1.01
– Median list price: $520,000
– Median sale price: $504,000
– Total homes sold: 329
– Share that sold above list: 49.8%

Dancestrokes // Shutterstock
#47. San Diego, California
– Average sale to list ratio: 1.01
– Median list price: $875,000
– Median sale price: $850,000
– Total homes sold: 2,256
– Share that sold above list: 52.7%

California Droning // Shutterstock
#46. Vallejo, California
– Average sale to list ratio: 1.01
– Median list price: $585,000
– Median sale price: $585,000
– Total homes sold: 397
– Share that sold above list: 56.2%
Cheri Alguire // Shutterstock
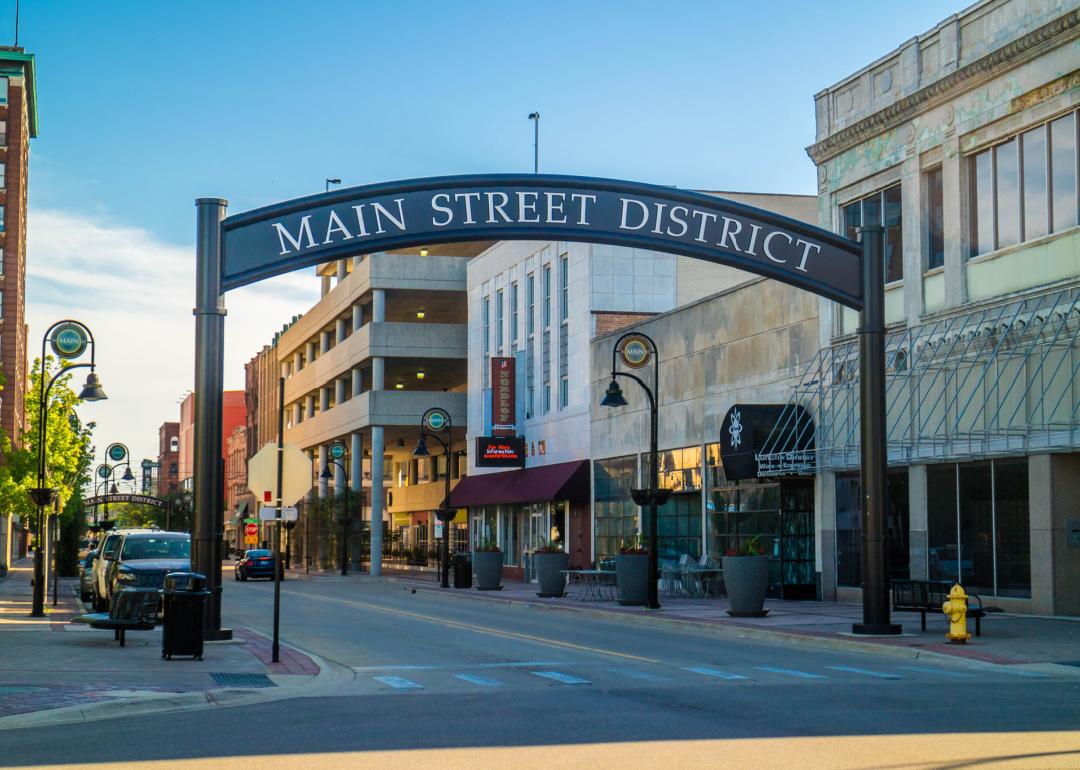
#45. Rockford, Illinois
– Average sale to list ratio: 1.01
– Median list price: $169,900
– Median sale price: $170,000
– Total homes sold: 347
– Share that sold above list: 55.6%
ImagineerInc // Shutterstock
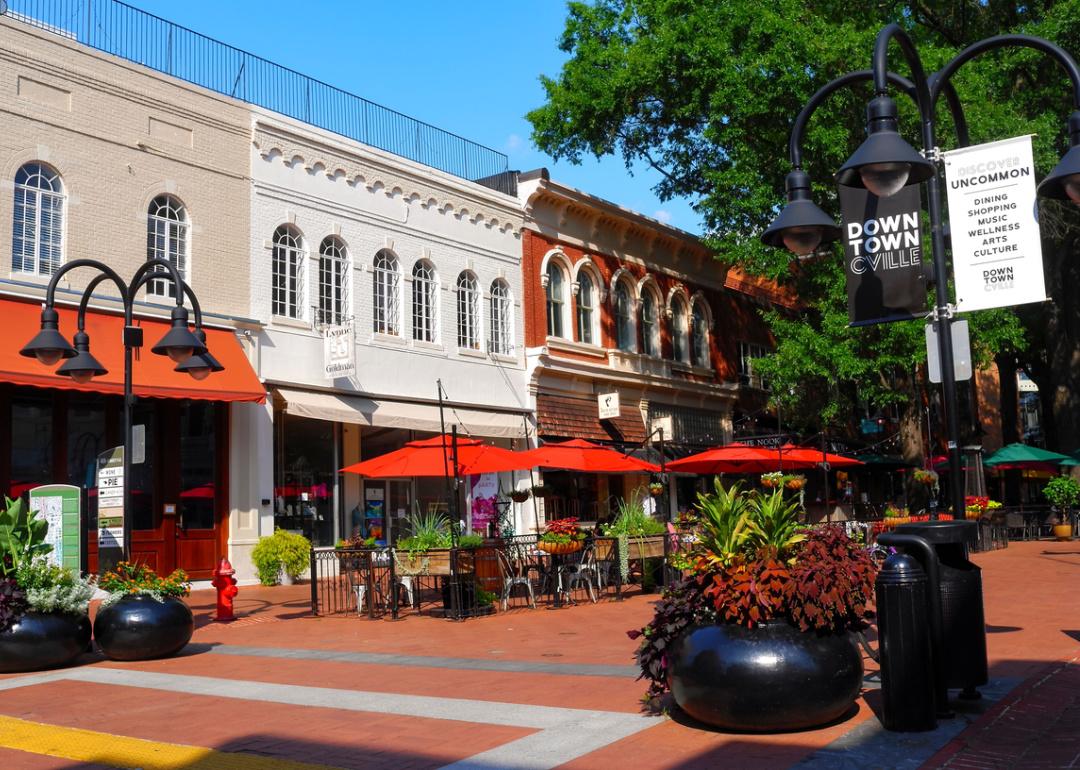
#44. Charlottesville, Virginia
– Average sale to list ratio: 1.01
– Median list price: $475,000
– Median sale price: $463,750
– Total homes sold: 319
– Share that sold above list: 49.2%

Sean Pavone // Shutterstock
#43. Durham, North Carolina
– Average sale to list ratio: 1.01
– Median list price: $443,950
– Median sale price: $430,000
– Total homes sold: 824
– Share that sold above list: 48.1%

Orhan Cam // Shutterstock
#42. Washington, DC
– Average sale to list ratio: 1.01
– Median list price: $559,900
– Median sale price: $560,000
– Total homes sold: 5,624
– Share that sold above list: 51.0%

Canva
#41. Cincinnati, Ohio
– Average sale to list ratio: 1.01
– Median list price: $289,900
– Median sale price: $289,502
– Total homes sold: 2,316
– Share that sold above list: 49.0%
Canva
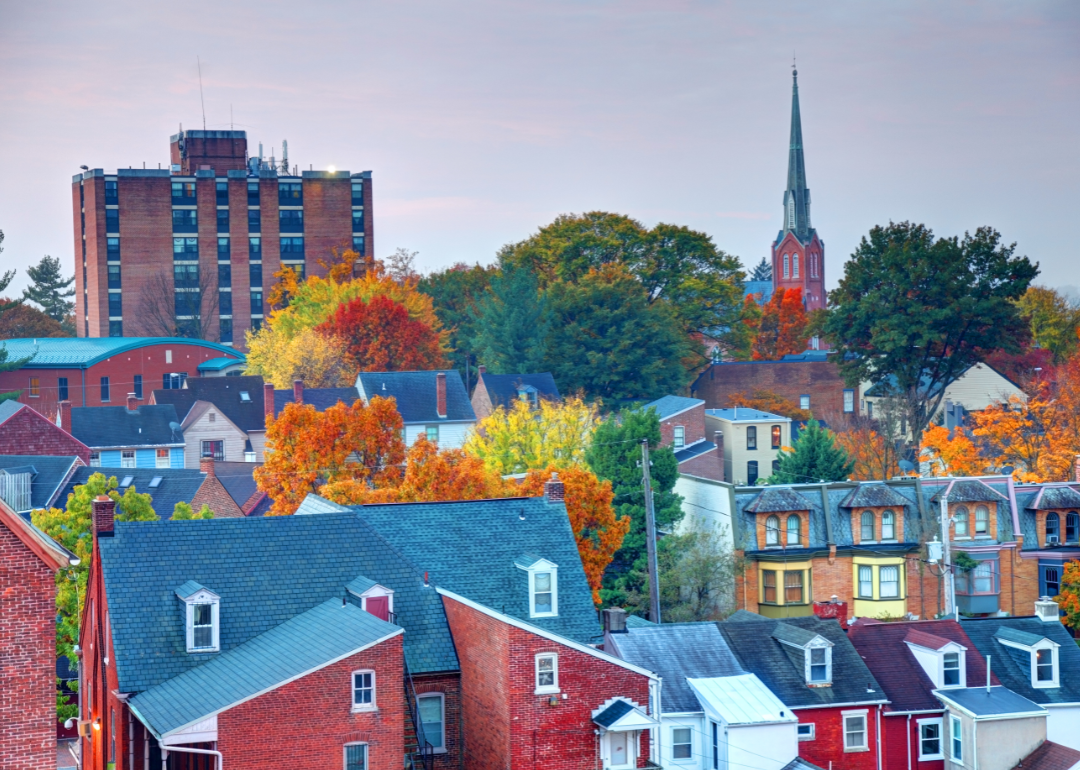
#40. Lancaster, Pennsylvania
– Average sale to list ratio: 1.01
– Median list price: $319,900
– Median sale price: $309,175
– Total homes sold: 420
– Share that sold above list: 40.7%

f11photo // Shutterstock
#39. Baltimore, Maryland
– Average sale to list ratio: 1.01
– Median list price: $374,925
– Median sale price: $370,000
– Total homes sold: 3,343
– Share that sold above list: 51.4%
kan_khampanya // Shutterstock
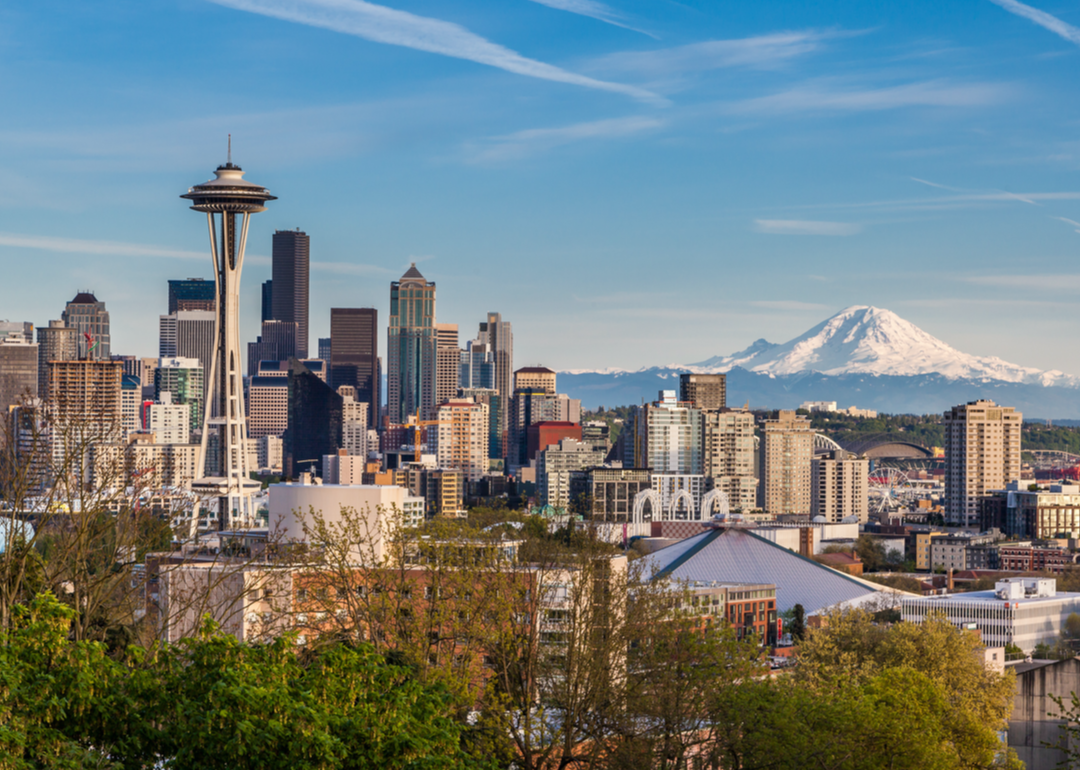
#38. Seattle, Washington
– Average sale to list ratio: 1.01
– Median list price: $799,950
– Median sale price: $800,000
– Total homes sold: 3,166
– Share that sold above list: 45.4%

Canva
#37. Lansing, Michigan
– Average sale to list ratio: 1.01
– Median list price: $225,000
– Median sale price: $209,000
– Total homes sold: 546
– Share that sold above list: 51.5%

Canva
#36. Elgin, Illinois
– Average sale to list ratio: 1.01
– Median list price: $334,900
– Median sale price: $328,995
– Total homes sold: 812
– Share that sold above list: 55.8%

Canva
#35. New Brunswick, New Jersey
– Average sale to list ratio: 1.02
– Median list price: $539,900
– Median sale price: $479,000
– Total homes sold: 2,292
– Share that sold above list: 52.0%

Jacob Boomsma // Shutterstock
#34. Omaha, Nebraska
– Average sale to list ratio: 1.02
– Median list price: $305,000
– Median sale price: $307,000
– Total homes sold: 1,208
– Share that sold above list: 48.0%

ostreetphotography // Shutterstock
#33. Minneapolis, Minnesota
– Average sale to list ratio: 1.02
– Median list price: $395,000
– Median sale price: $370,000
– Total homes sold: 4,105
– Share that sold above list: 51.5%

Canva
#32. Allentown, Pennsylvania
– Average sale to list ratio: 1.02
– Median list price: $345,000
– Median sale price: $310,000
– Total homes sold: 719
– Share that sold above list: 51.0%

Joe Hendrickson // Shutterstock
#31. St. Louis, Missouri
– Average sale to list ratio: 1.02
– Median list price: $249,900
– Median sale price: $250,743
– Total homes sold: 3,219
– Share that sold above list: 52.7%

Sean Pavone // Shutterstock
#30. Providence, Rhode Island
– Average sale to list ratio: 1.02
– Median list price: $455,450
– Median sale price: $431,000
– Total homes sold: 1,320
– Share that sold above list: 56.5%

Sean Pavone // Shutterstock
#29. Columbus, Ohio
– Average sale to list ratio: 1.02
– Median list price: $340,000
– Median sale price: $340,000
– Total homes sold: 2,445
– Share that sold above list: 53.7%

trekandshoot // Shutterstock
#28. Santa Rosa, California
– Average sale to list ratio: 1.02
– Median list price: $849,000
– Median sale price: $830,000
– Total homes sold: 390
– Share that sold above list: 50.8%
Paul Brady Photography // Shutterstock
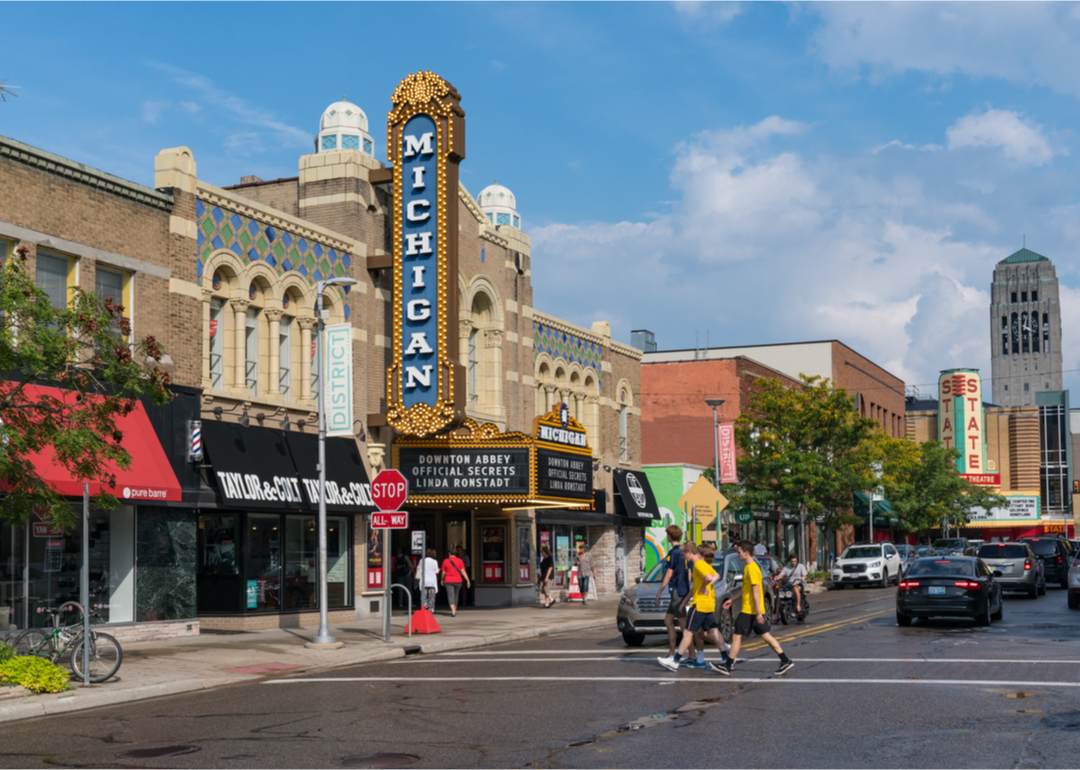
#27. Ann Arbor, Michigan
– Average sale to list ratio: 1.02
– Median list price: $400,000
– Median sale price: $415,000
– Total homes sold: 412
– Share that sold above list: 54.4%

Delmas Lehman // Shutterstock
#26. Montgomery County, Pennsylvania
– Average sale to list ratio: 1.02
– Median list price: $484,900
– Median sale price: $435,000
– Total homes sold: 1,779
– Share that sold above list: 54.4%
Wangkun Jia // Shutterstock
#25. Camden, New Jersey
– Average sale to list ratio: 1.02
– Median list price: $320,000
– Median sale price: $310,000
– Total homes sold: 1,209
– Share that sold above list: 59.1%
Canva
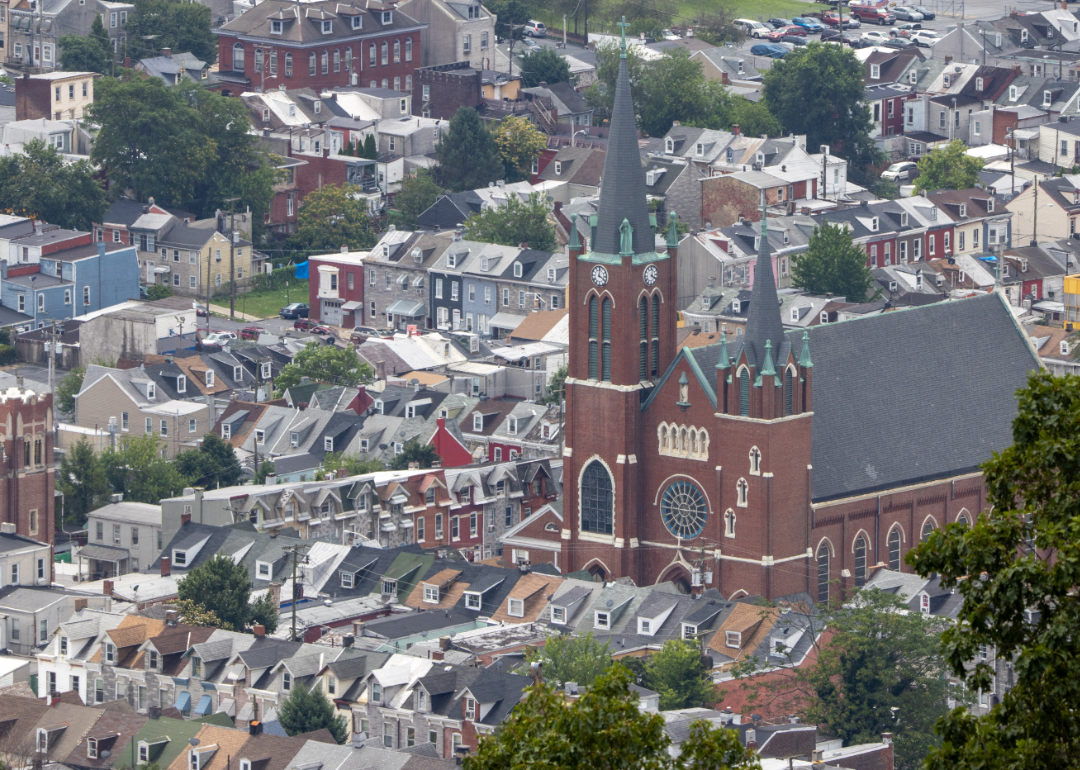
#24. Reading, Pennsylvania
– Average sale to list ratio: 1.02
– Median list price: $268,700
– Median sale price: $260,000
– Total homes sold: 371
– Share that sold above list: 55.3%

Canva
#23. Bridgeport, Connecticut
– Average sale to list ratio: 1.03
– Median list price: $681,500
– Median sale price: $589,900
– Total homes sold: 819
– Share that sold above list: 56.2%

Christian Hinkle // Shutterstock
#22. Frederick, Maryland
– Average sale to list ratio: 1.03
– Median list price: $550,000
– Median sale price: $575,000
– Total homes sold: 1,352
– Share that sold above list: 58.1%

Wangkun Jia // Shutterstock
#21. Albany, New York
– Average sale to list ratio: 1.03
– Median list price: $309,900
– Median sale price: $293,000
– Total homes sold: 672
– Share that sold above list: 57.4%

Canva
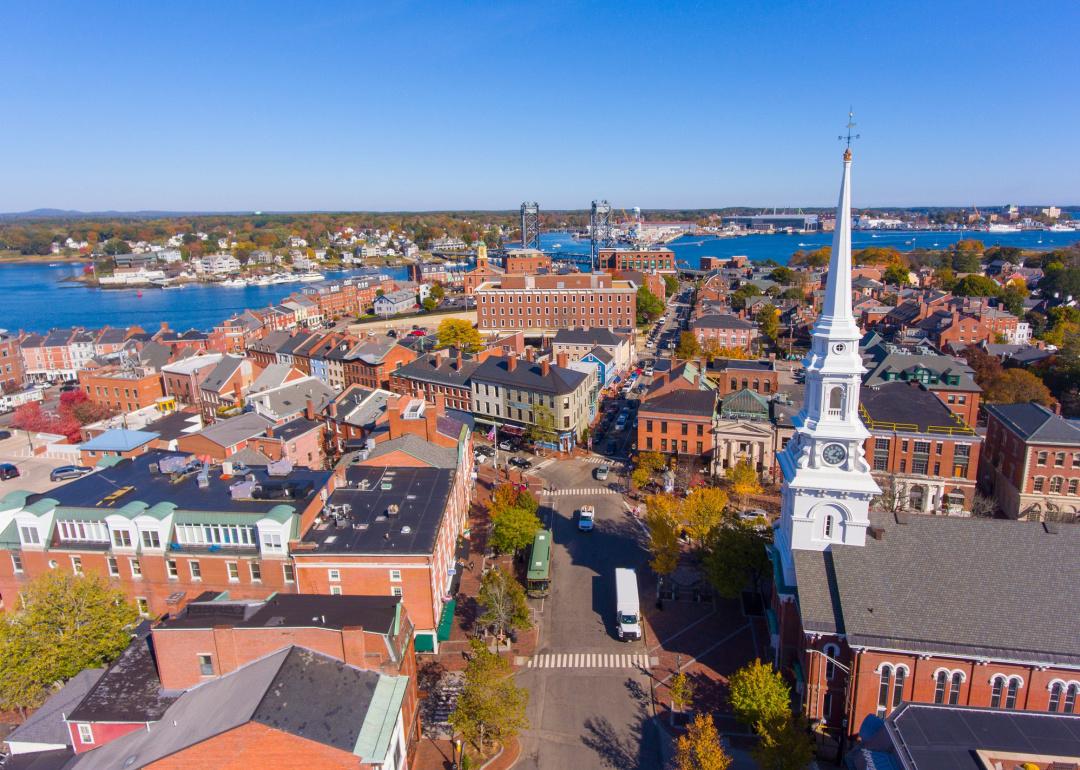
#20. Rockingham County, New Hampshire
– Average sale to list ratio: 1.03
– Median list price: $579,311
– Median sale price: $519,500
– Total homes sold: 438
– Share that sold above list: 63.0%

Erin Cadigan // Shutterstock
#19. Richmond, Virginia
– Average sale to list ratio: 1.03
– Median list price: $375,000
– Median sale price: $370,000
– Total homes sold: 1,580
– Share that sold above list: 58.9%

Canva
#18. New Haven, Connecticut
– Average sale to list ratio: 1.03
– Median list price: $339,000
– Median sale price: $330,000
– Total homes sold: 749
– Share that sold above list: 61.5%

lunamarina // Shutterstock
#17. Boston, Massachusetts
– Average sale to list ratio: 1.03
– Median list price: $749,900
– Median sale price: $700,000
– Total homes sold: 3,384
– Share that sold above list: 60.9%
marchello74 // Shutterstock
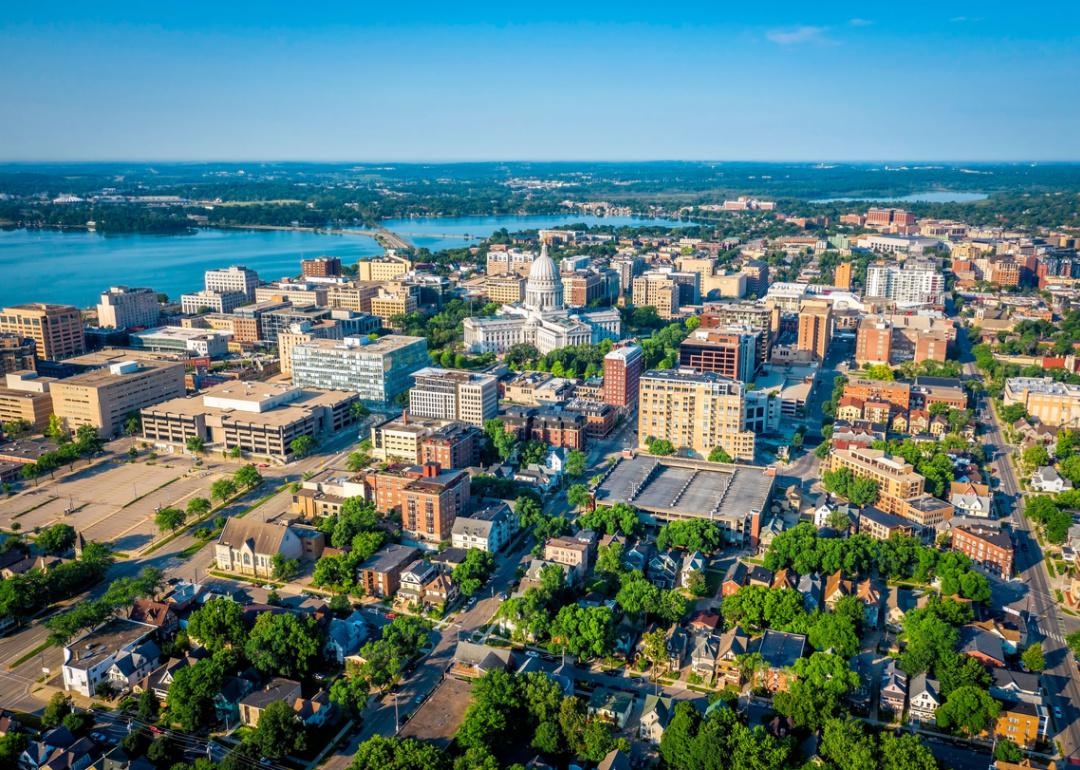
#16. Madison, Wisconsin
– Average sale to list ratio: 1.03
– Median list price: $390,000
– Median sale price: $396,000
– Total homes sold: 711
– Share that sold above list: 58.2%

Canva
#15. Springfield, Massachusetts
– Average sale to list ratio: 1.03
– Median list price: $324,950
– Median sale price: $310,000
– Total homes sold: 479
– Share that sold above list: 64.7%

Tony Savino // Shutterstock
#14. Milwaukee, Wisconsin
– Average sale to list ratio: 1.03
– Median list price: $309,000
– Median sale price: $310,000
– Total homes sold: 1,584
– Share that sold above list: 63.6%

Pete Niesen // Shutterstock
#13. San Francisco, California
– Average sale to list ratio: 1.03
– Median list price: $1,462,500
– Median sale price: $1,500,000
– Total homes sold: 889
– Share that sold above list: 56.2%

Canva
#12. Worcester, Massachusetts
– Average sale to list ratio: 1.03
– Median list price: $437,000
– Median sale price: $425,000
– Total homes sold: 758
– Share that sold above list: 69.3%

Canva
#11. Green Bay, Wisconsin
– Average sale to list ratio: 1.03
– Median list price: $309,900
– Median sale price: $286,500
– Total homes sold: 303
– Share that sold above list: 65.0%

Canva
#10. Grand Rapids, Michigan
– Average sale to list ratio: 1.03
– Median list price: $320,000
– Median sale price: $330,000
– Total homes sold: 1,022
– Share that sold above list: 57.7%

Canva
#9. Syracuse, New York
– Average sale to list ratio: 1.04
– Median list price: $205,000
– Median sale price: $197,750
– Total homes sold: 466
– Share that sold above list: 59.7%

Joseph Sohm // Shutterstock
#8. Portland, Maine
– Average sale to list ratio: 1.04
– Median list price: $550,000
– Median sale price: $480,000
– Total homes sold: 569
– Share that sold above list: 58.0%
Uladzik Kryhin // Shutterstock
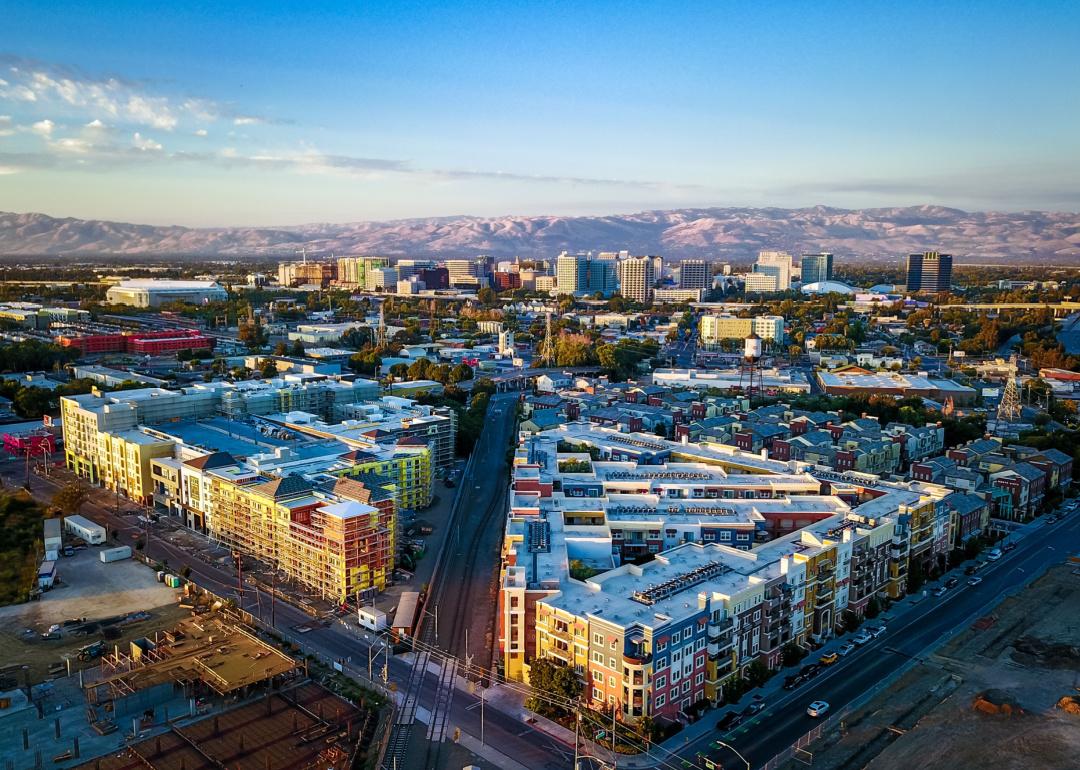
#7. San Jose, California
– Average sale to list ratio: 1.04
– Median list price: $1,452,944
– Median sale price: $1,478,500
– Total homes sold: 1,209
– Share that sold above list: 65.0%

Uladzik Kryhin // Shutterstock
#6. Newark, New Jersey
– Average sale to list ratio: 1.04
– Median list price: $545,000
– Median sale price: $526,920
– Total homes sold: 1,704
– Share that sold above list: 64.8%

Sean Pavone // Shutterstock
#5. Manchester, New Hampshire
– Average sale to list ratio: 1.04
– Median list price: $475,000
– Median sale price: $459,900
– Total homes sold: 363
– Share that sold above list: 71.6%

Canva
#4. Oakland, California
– Average sale to list ratio: 1.05
– Median list price: $899,000
– Median sale price: $950,000
– Total homes sold: 2,048
– Share that sold above list: 67.4%

Sean Pavone // Shutterstock
#3. Hartford, Connecticut
– Average sale to list ratio: 1.05
– Median list price: $324,950
– Median sale price: $330,000
– Total homes sold: 1,063
– Share that sold above list: 71.8%
Canva
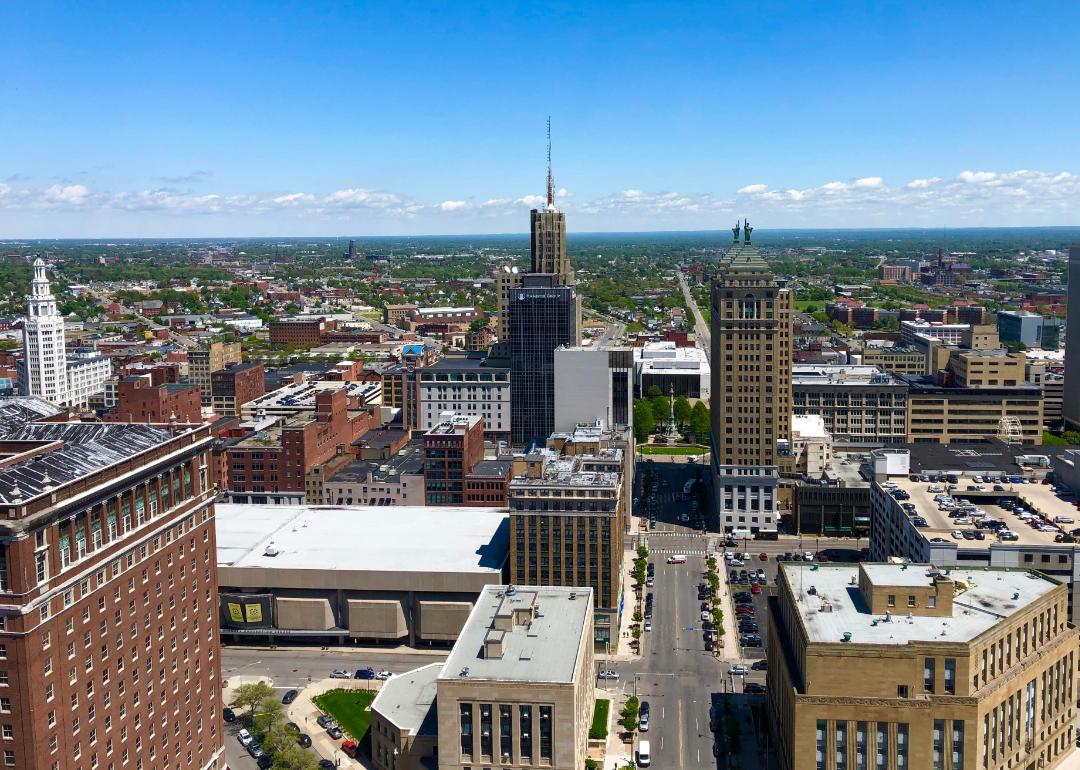
#2. Buffalo, New York
– Average sale to list ratio: 1.05
– Median list price: $227,750
– Median sale price: $230,000
– Total homes sold: 783
– Share that sold above list: 62.7%

Canva
#1. Rochester, New York
– Average sale to list ratio: 1.12
– Median list price: $199,999
– Median sale price: $232,504
– Total homes sold: 774
– Share that sold above list: 72.7%