Counties with the most emergency shelters in California

Susan Popielaski // Wikimedia Commons
Counties with the most emergency shelters in California
As climate change drives weather to greater extremes, and devastating hurricanes, wildfires, droughts, and blizzards preoccupy an increasing number of Americans, it is hard to avoid comparing the reality of everyday news coverage to the computer-generated images seen in disaster movies.
Over the last 50 years, natural disasters have become five times more common due to climate change, according to the World Meteorological Organization. They’ve also become more economically debilitating—the five most expensive climate disasters in American history have all taken place over the last two decades.
The increasing frequency and severity of natural disasters means that the need for emergency evacuation and shelter plans has never been greater. According to the Federal Emergency Management Association, understanding your climate risk, or proximity to probable natural disaster, is an important first step for making a plan. Tools like the Climate Mapping for Resilience and Adaptation allow you to assess your risk by location.
Knowing where nearby emergency shelters are located is another way to prepare for the worst. In the event of flooding, hurricane-level winds, or other disasters, emergency shelters offer a place to sleep, and also often provide food, water, and first aid services. Stacker examined the Department of Homeland Security’s National Shelter System Facilities database to identify the counties with the most emergency shelters in California. Counties are ranked by emergency shelters per 100K people, with total capacity per 100K people serving as a tiebreaker.
![]()
Doug Olson // Wikimedia Commons
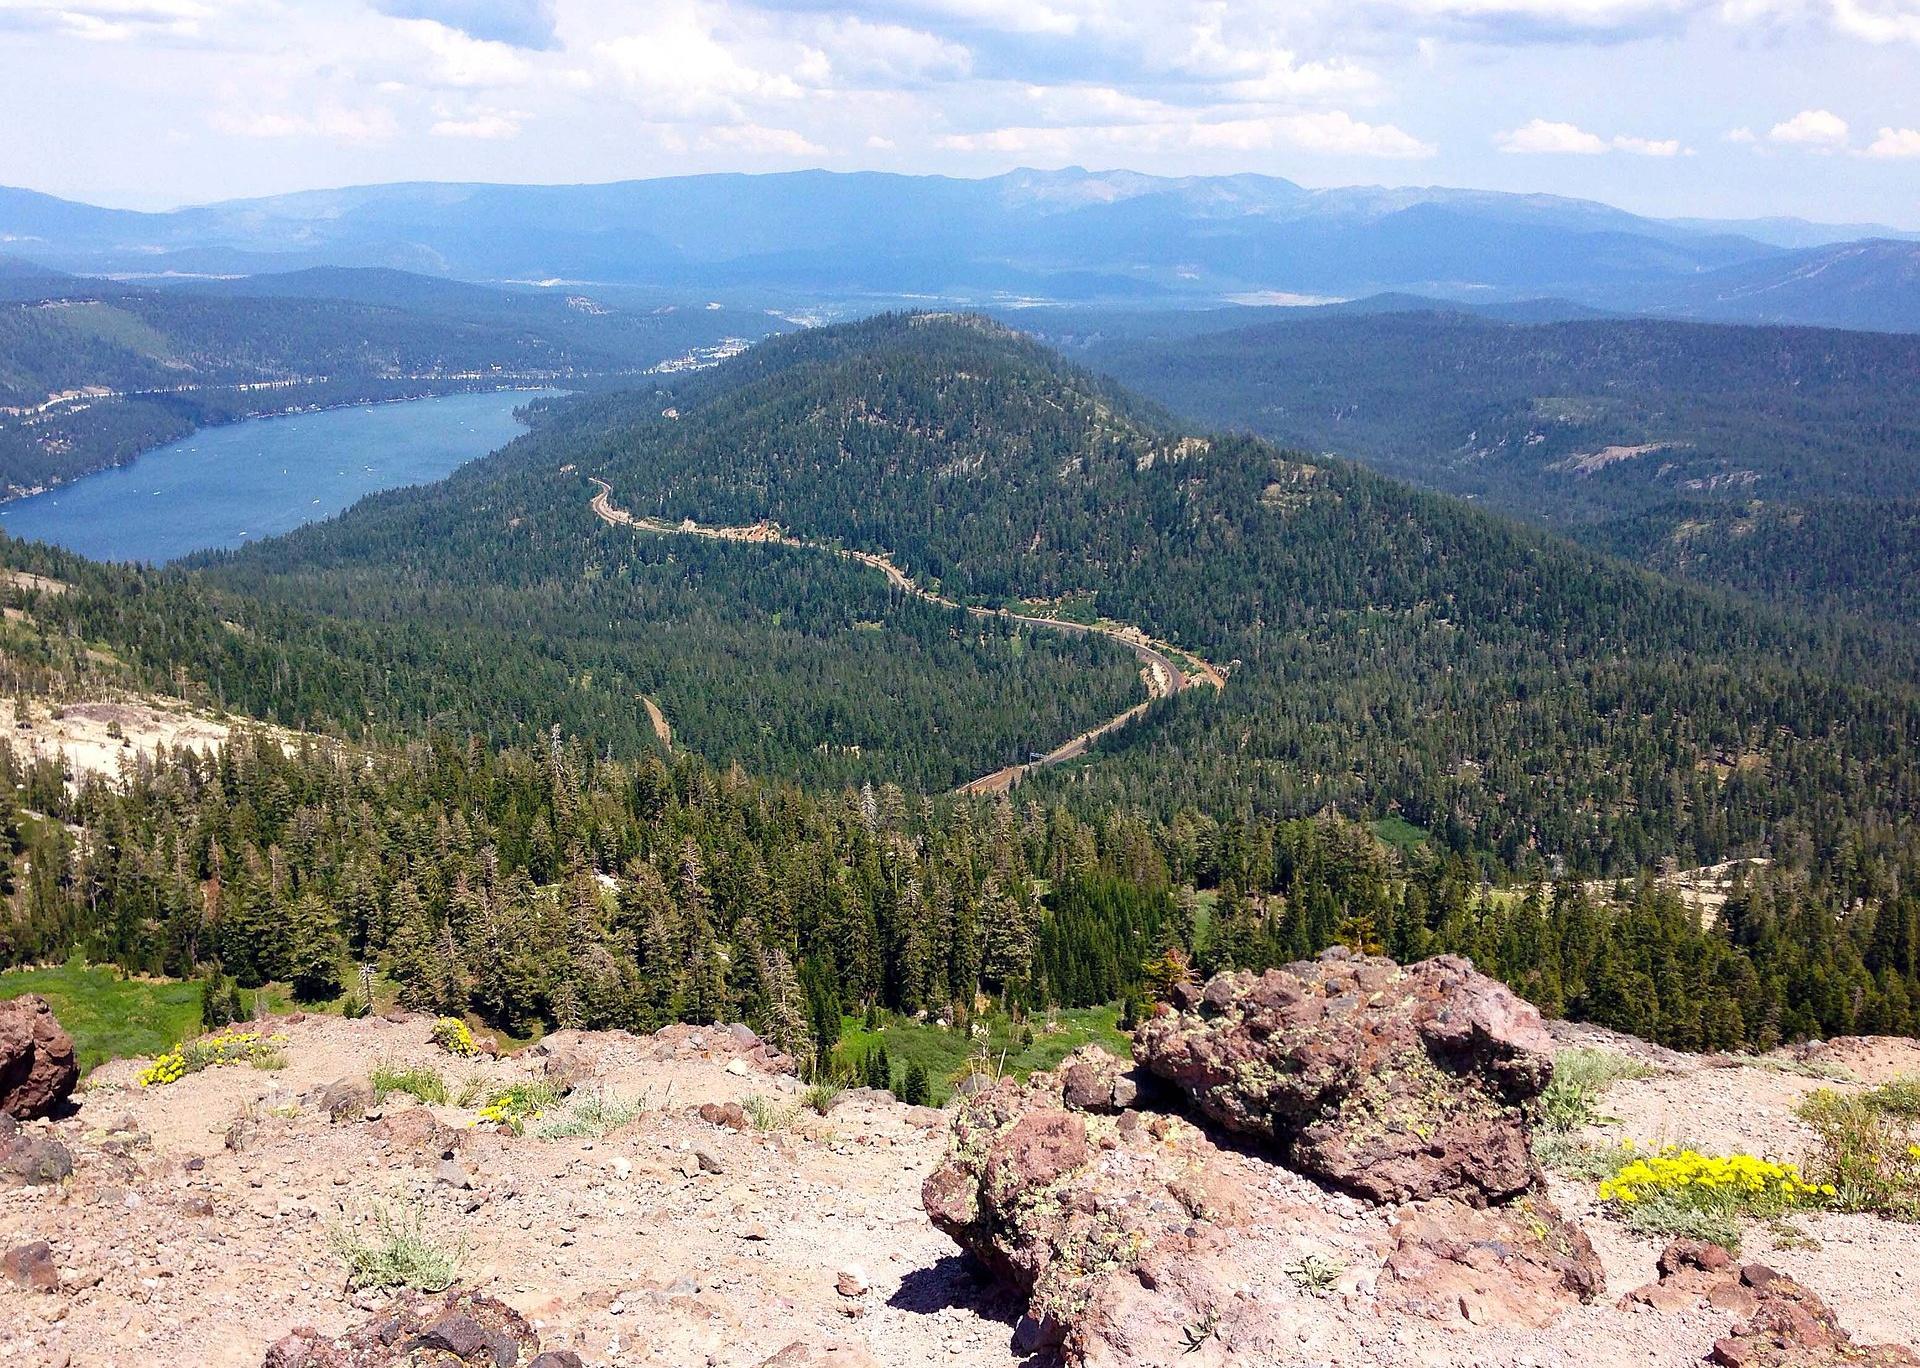
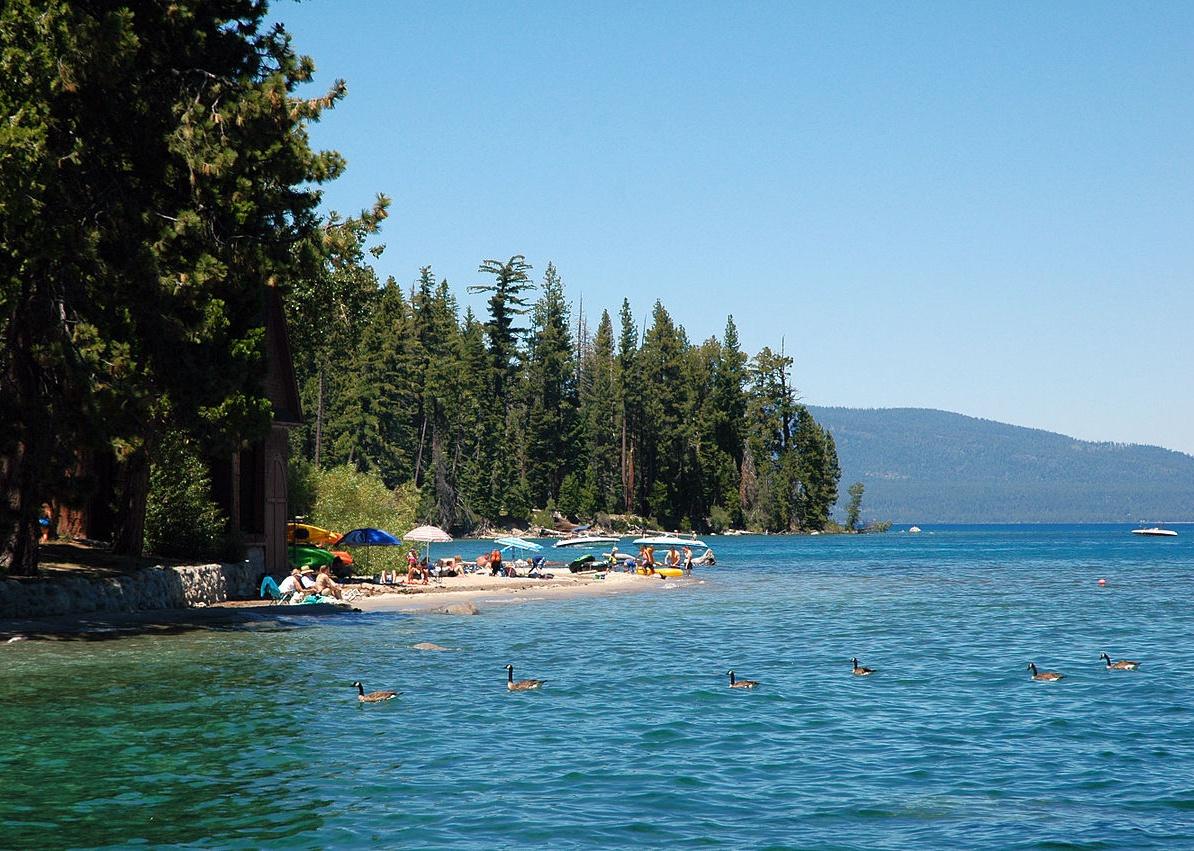
#50. Placer County
– Emergency shelters per 100K people: 15.0 (60 shelters in database)
– Emergency shelter capacity per 100K: 4,979,578 people (19,934,743 total capacity)
– Shelters with generators: 0
– Shelters in 100-year floodplain: 2
BDS2006 // Wikimedia
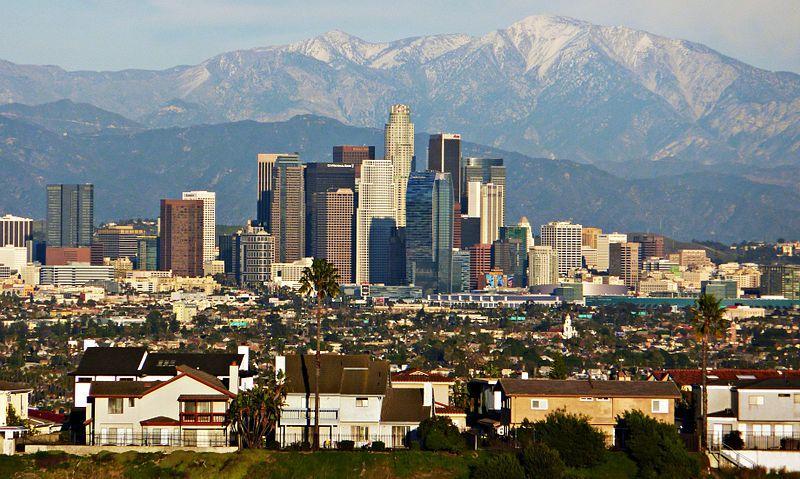
#49. Los Angeles County
– Emergency shelters per 100K people: 15.7 (1573 shelters in database)
– Emergency shelter capacity per 100K: 3,779,002 people (378,642,161 total capacity)
– Shelters with generators: 157
– Shelters in 100-year floodplain: 31
Michael Patrick // Wikimedia Commons
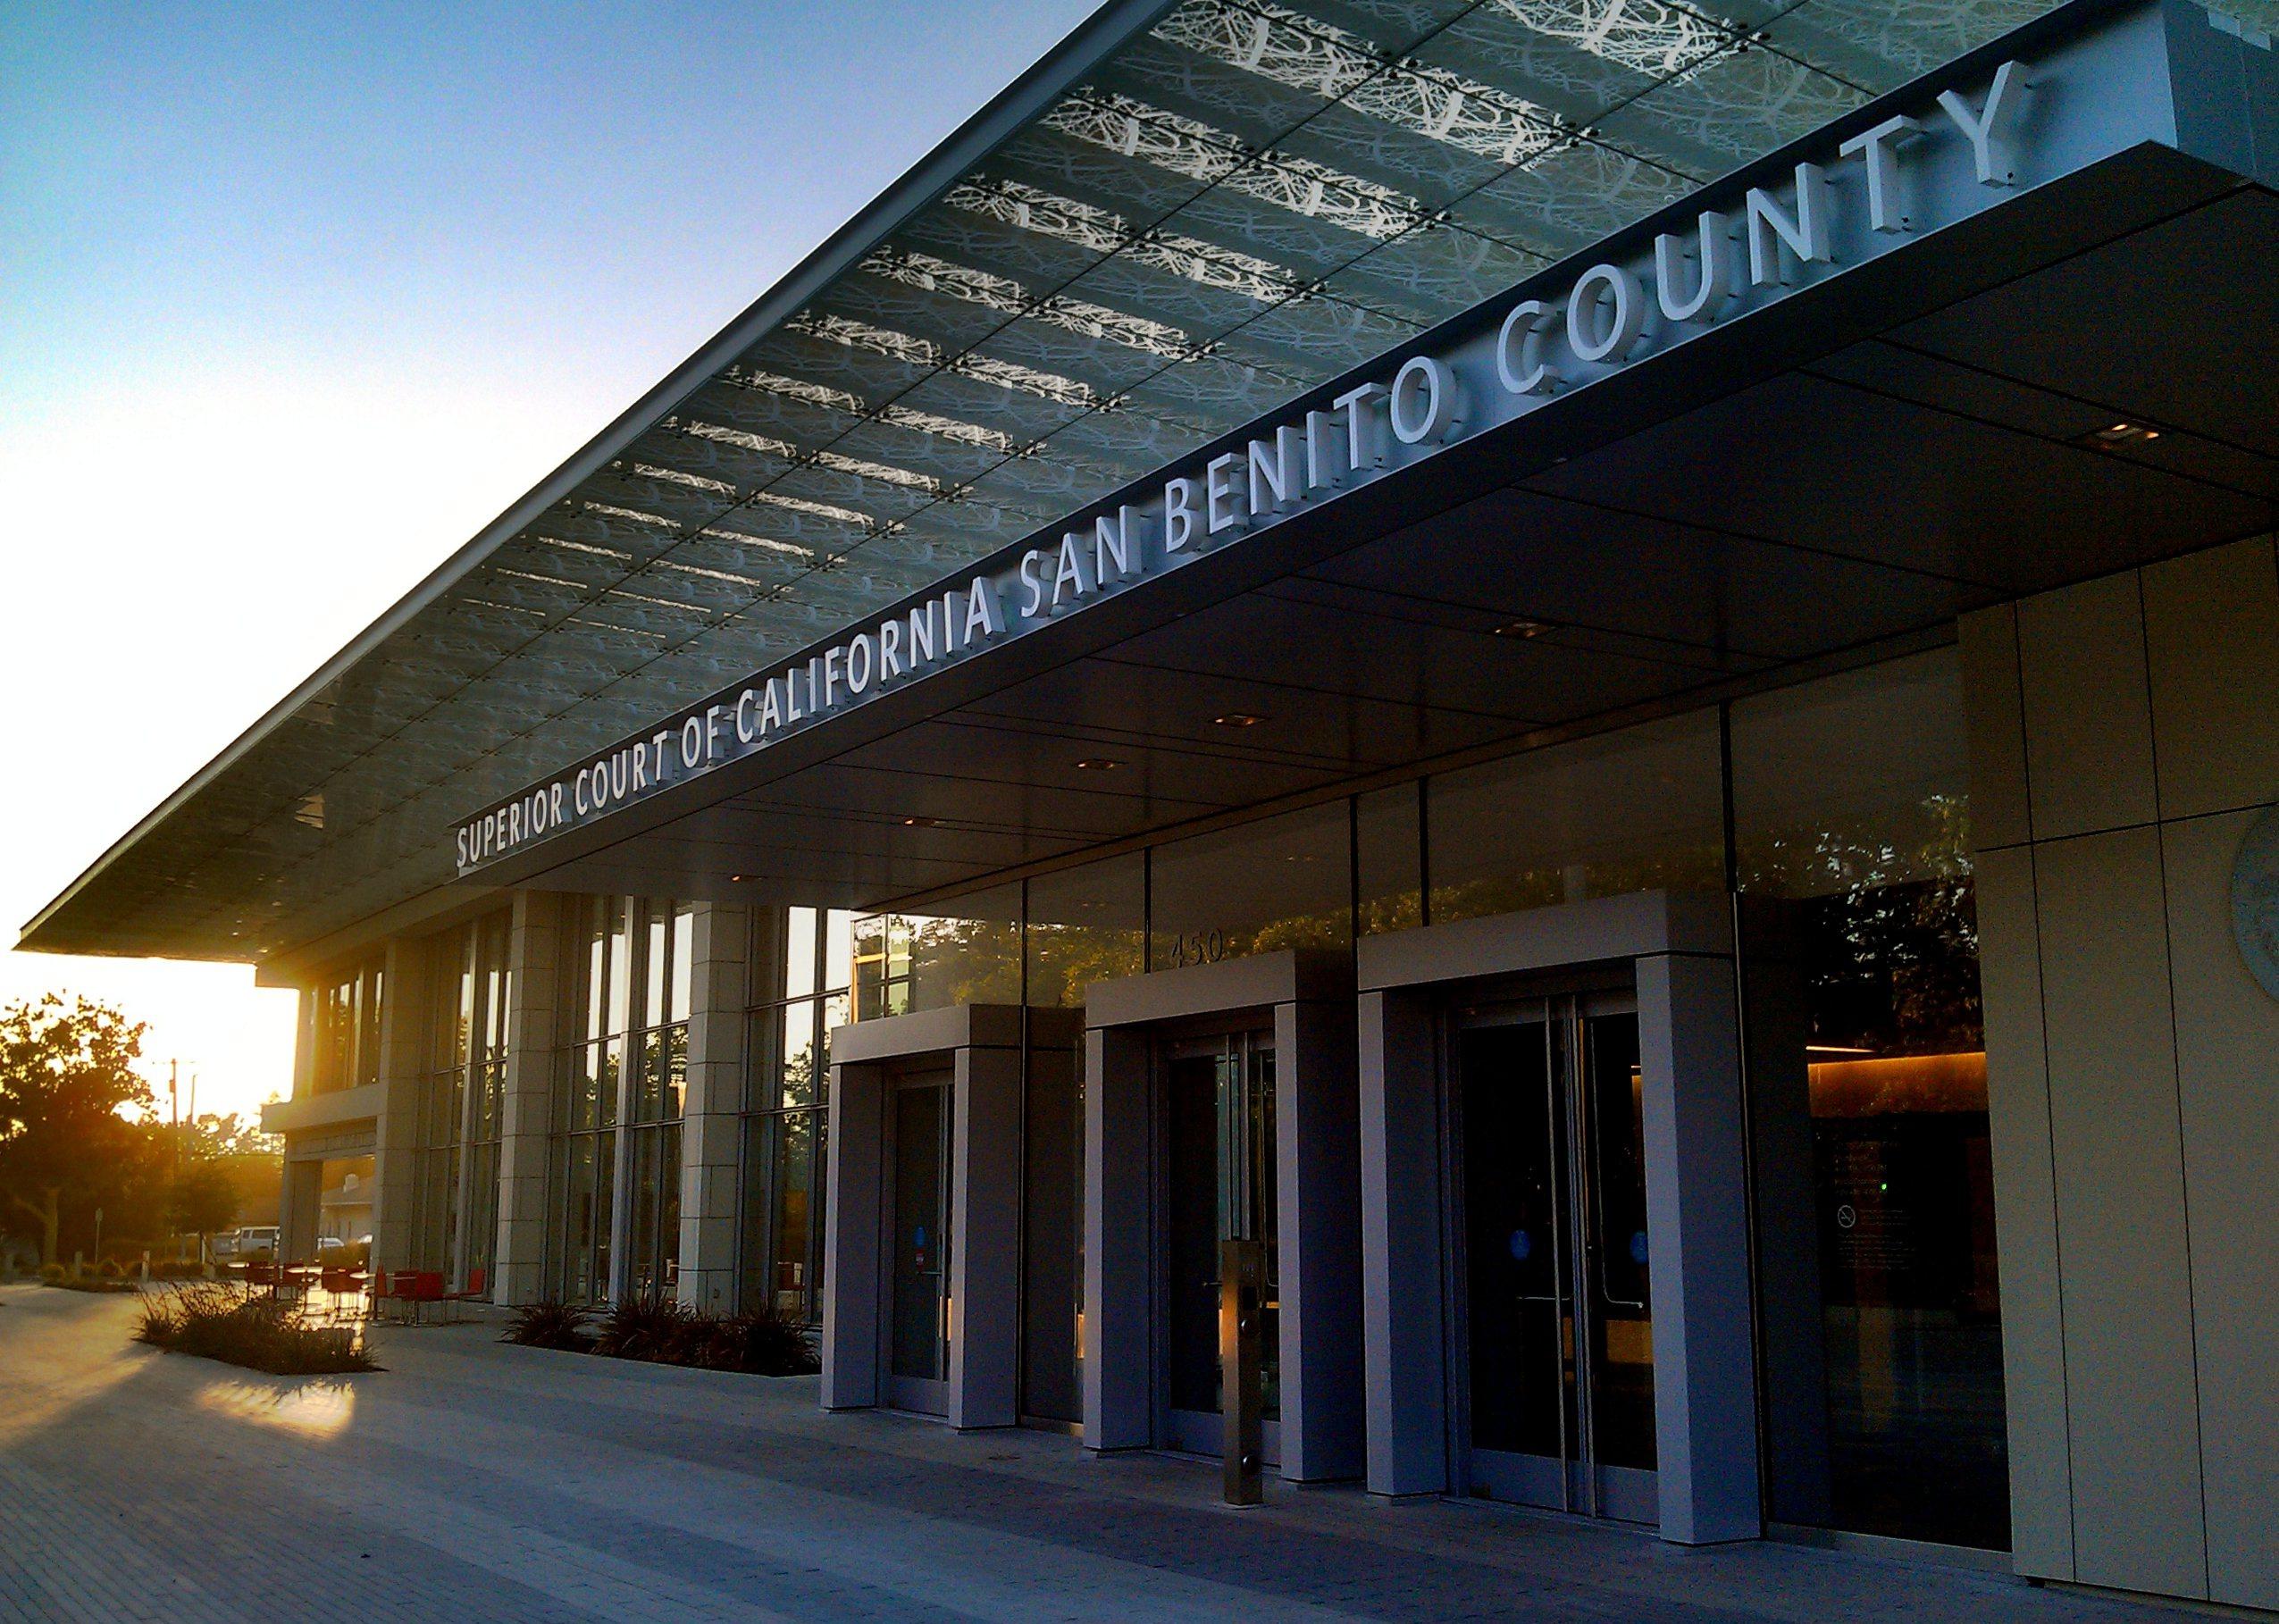
#48. San Benito County
– Emergency shelters per 100K people: 15.8 (10 shelters in database)
– Emergency shelter capacity per 100K: 3,555,324 people (2,251,551 total capacity)
– Shelters with generators: 0
– Shelters in 100-year floodplain: 0

Public Domain
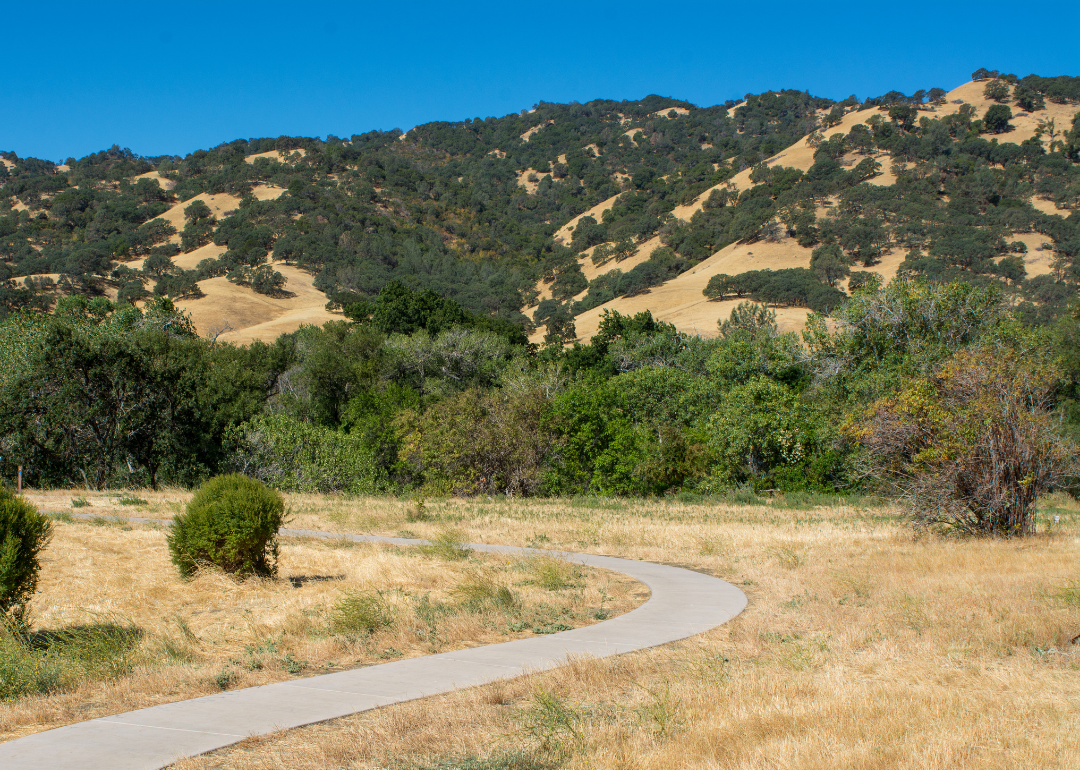
#47. Stanislaus County
– Emergency shelters per 100K people: 16.3 (90 shelters in database)
– Emergency shelter capacity per 100K: 3,759,557 people (20,709,220 total capacity)
– Shelters with generators: 5
– Shelters in 100-year floodplain: 2
Canva
#46. Solano County
– Emergency shelters per 100K people: 17.3 (78 shelters in database)
– Emergency shelter capacity per 100K: 3,793,128 people (17,123,392 total capacity)
– Shelters with generators: 0
– Shelters in 100-year floodplain: 0

Canva
#45. Sacramento County
– Emergency shelters per 100K people: 17.4 (274 shelters in database)
– Emergency shelter capacity per 100K: 3,242,565 people (50,965,567 total capacity)
– Shelters with generators: 2
– Shelters in 100-year floodplain: 34
DimiTalen // Wikimedia Commons
#44. El Dorado County
– Emergency shelters per 100K people: 17.8 (34 shelters in database)
– Emergency shelter capacity per 100K: 6,221,615 people (11,856,407 total capacity)
– Shelters with generators: 3
– Shelters in 100-year floodplain: 0
Mark Miller // Wikimedia Commons
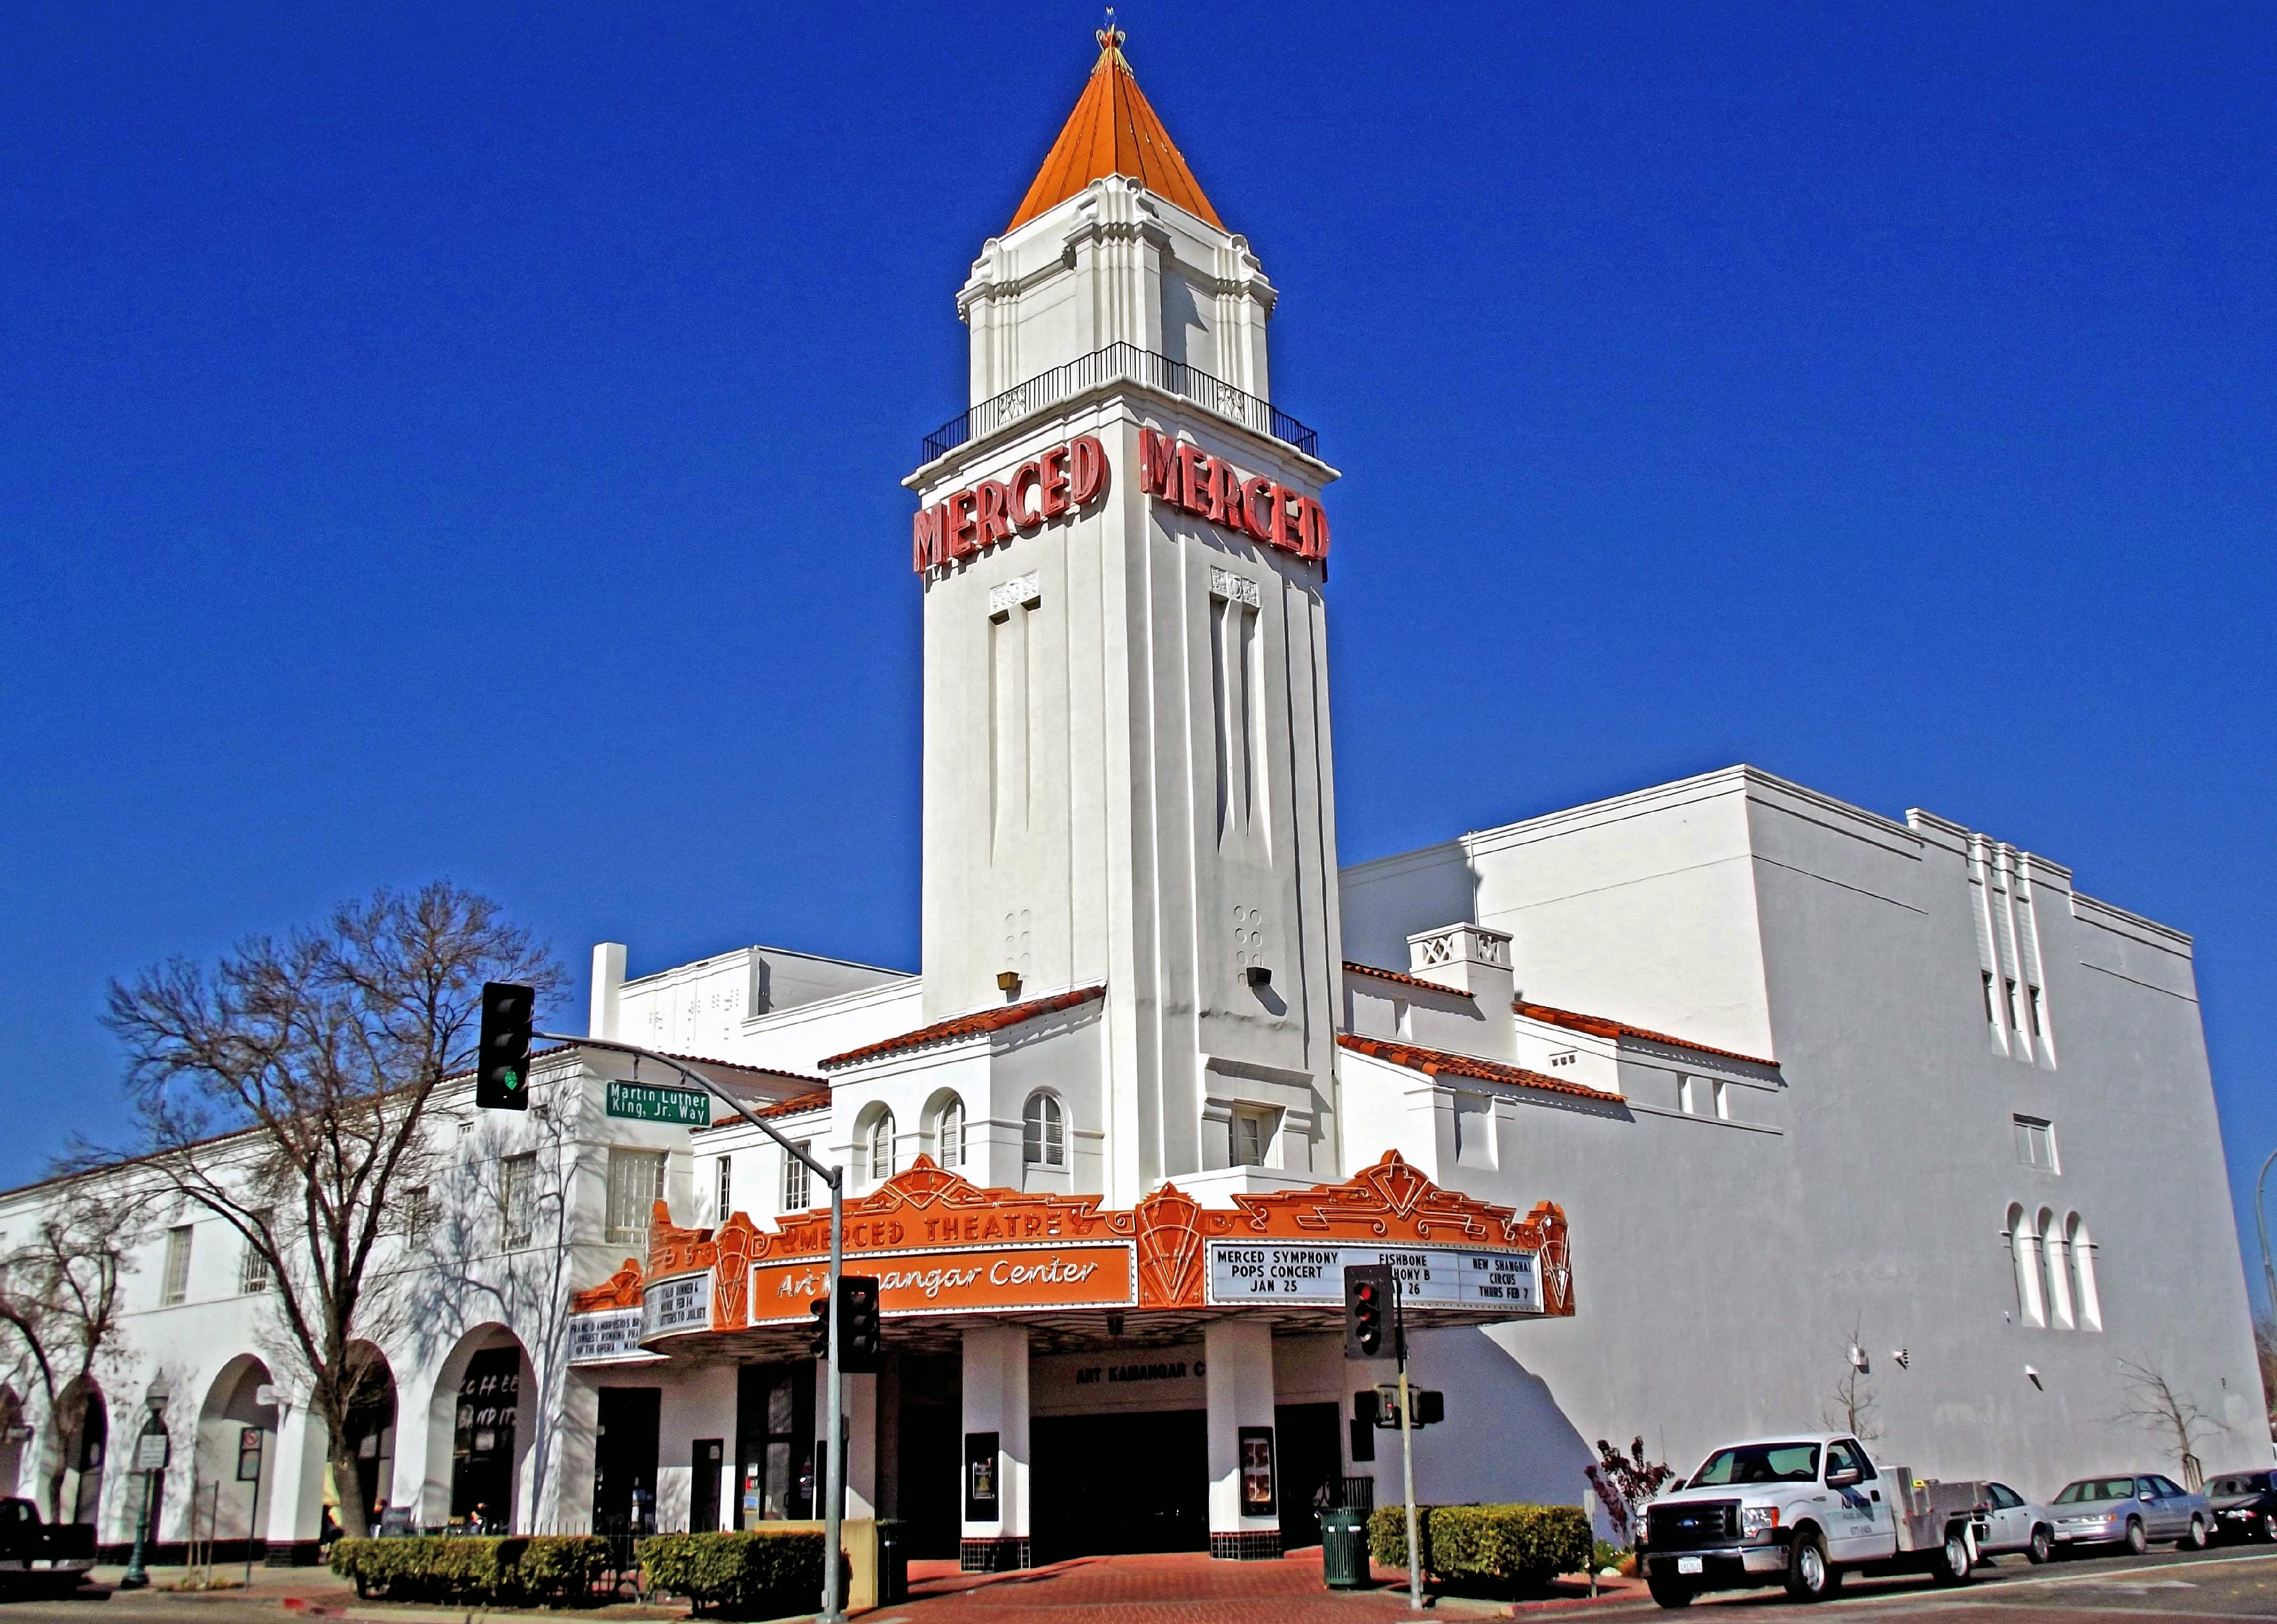
#43. Merced County
– Emergency shelters per 100K people: 17.9 (50 shelters in database)
– Emergency shelter capacity per 100K: 4,288,051 people (11,970,094 total capacity)
– Shelters with generators: 1
– Shelters in 100-year floodplain: 0
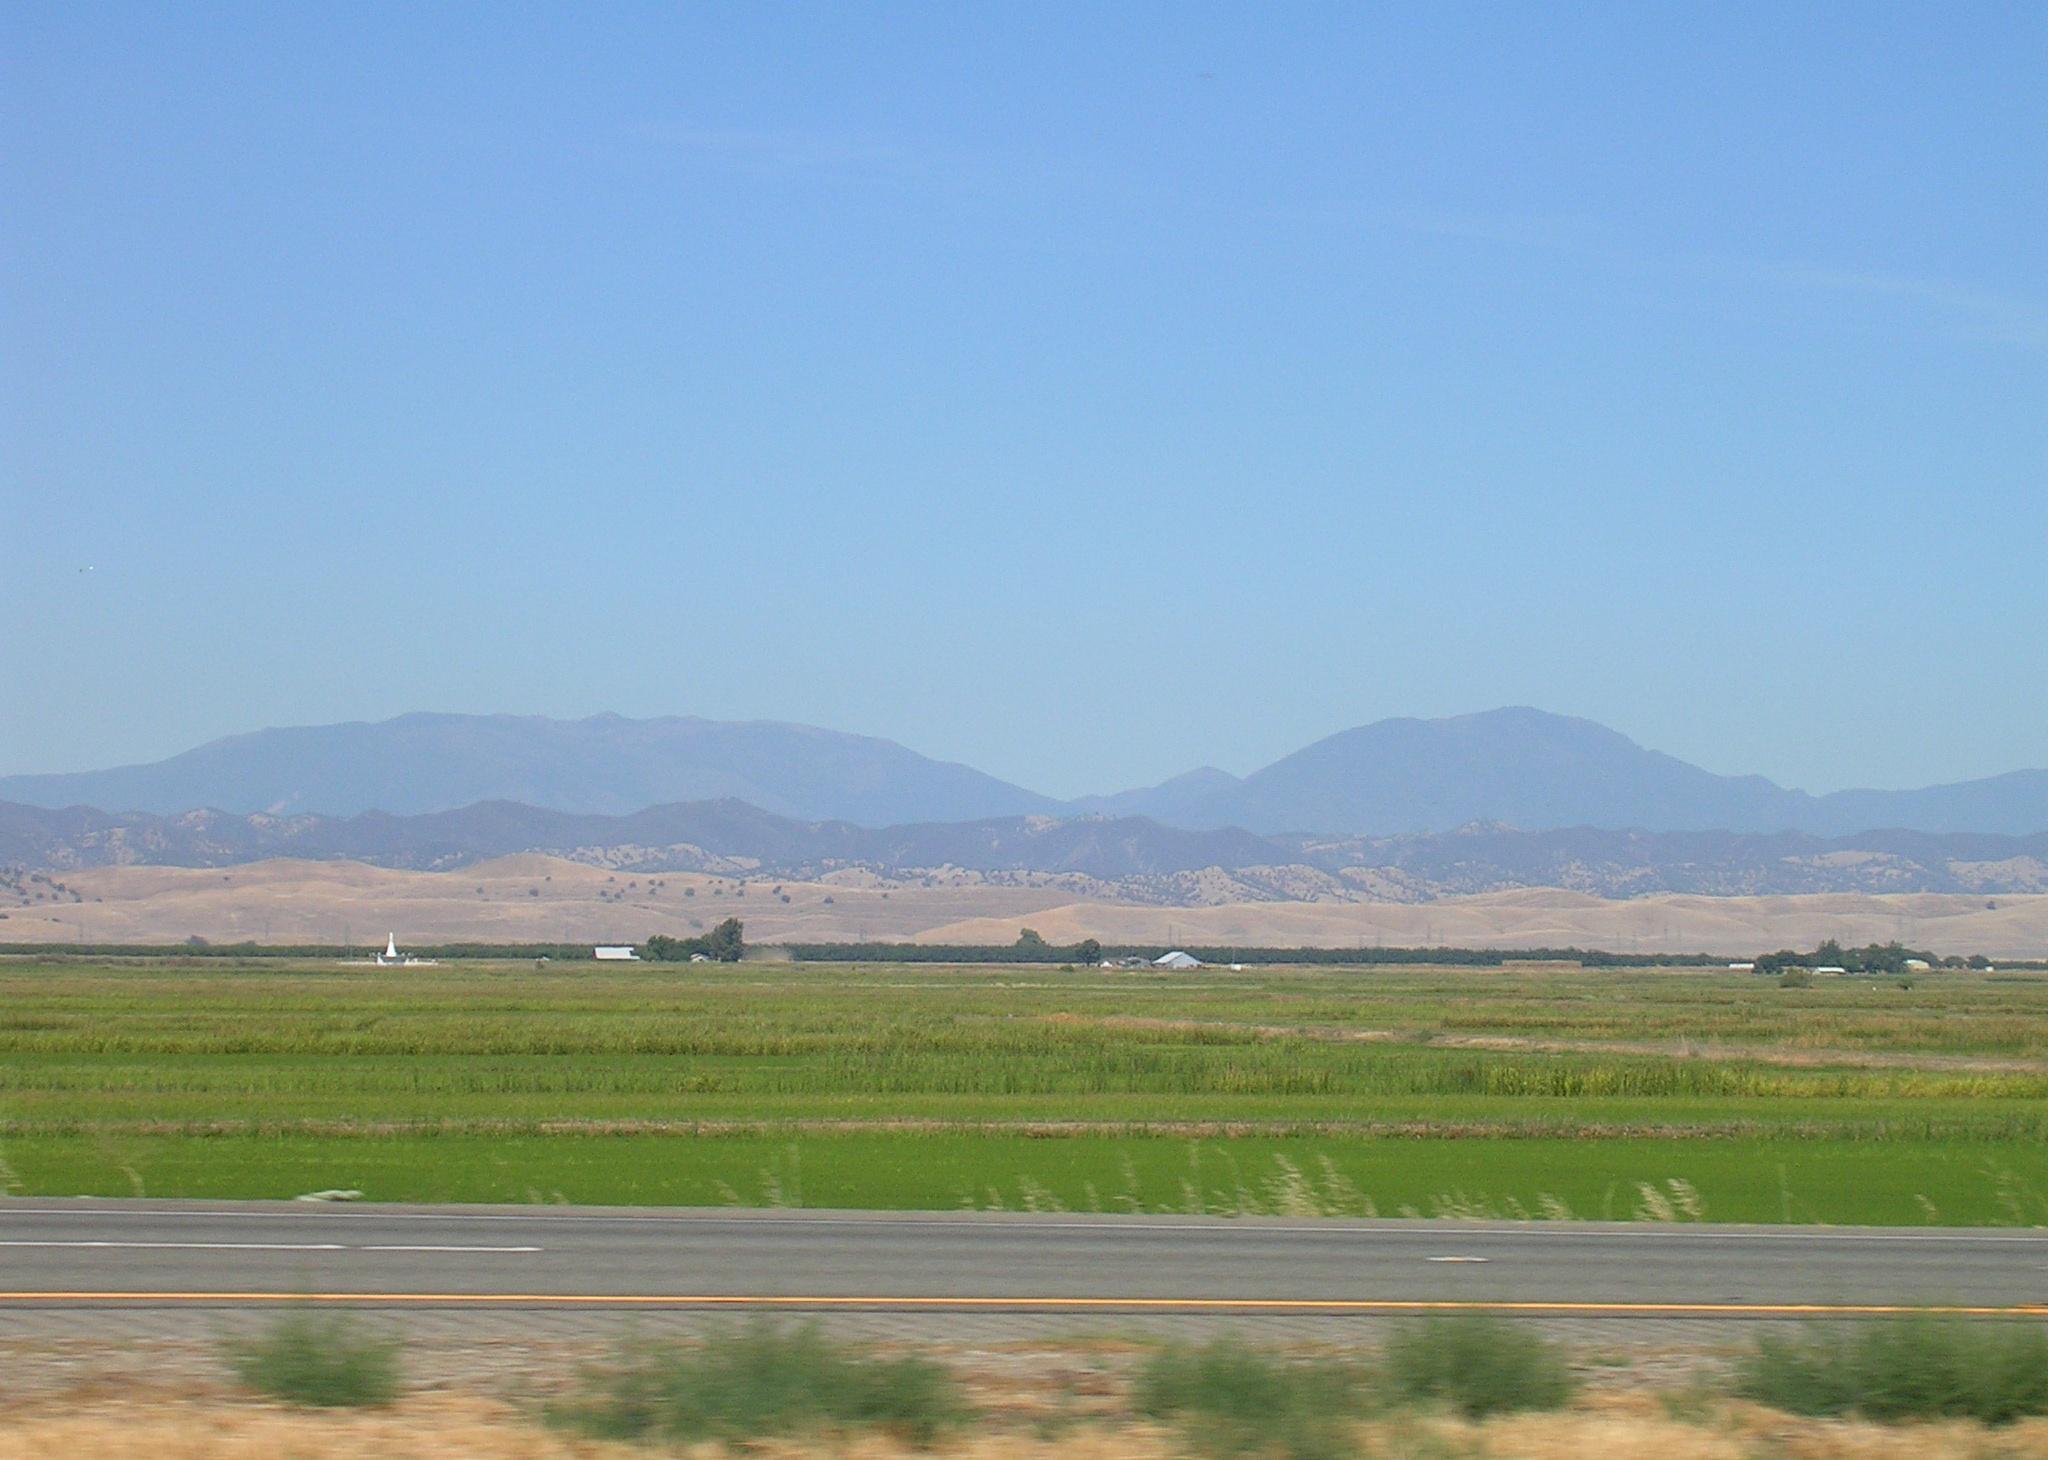
Armona // Wikicommons
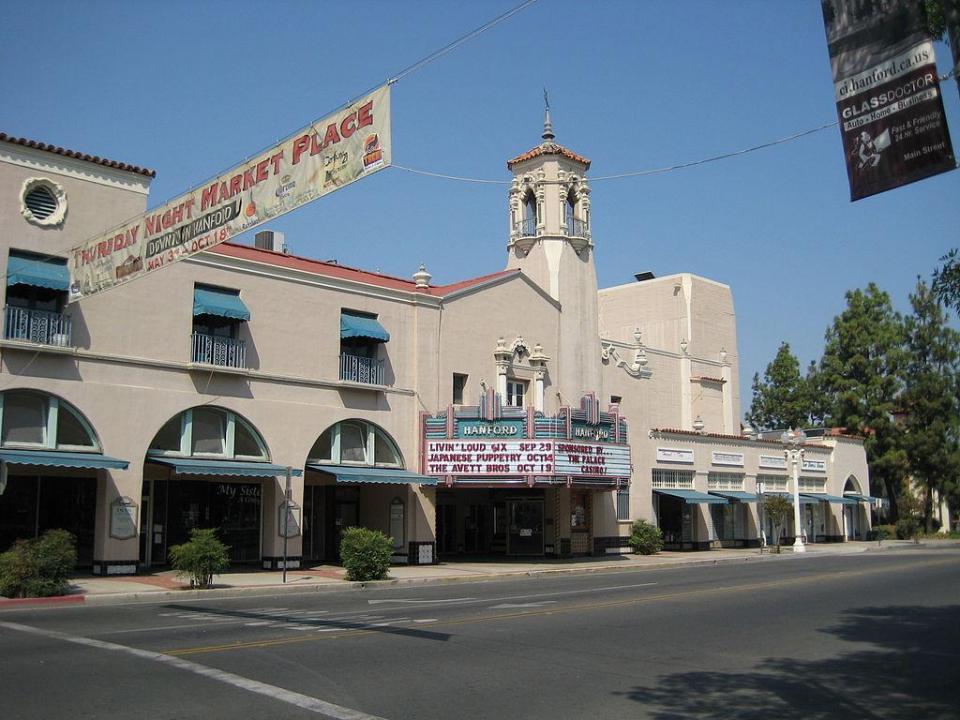
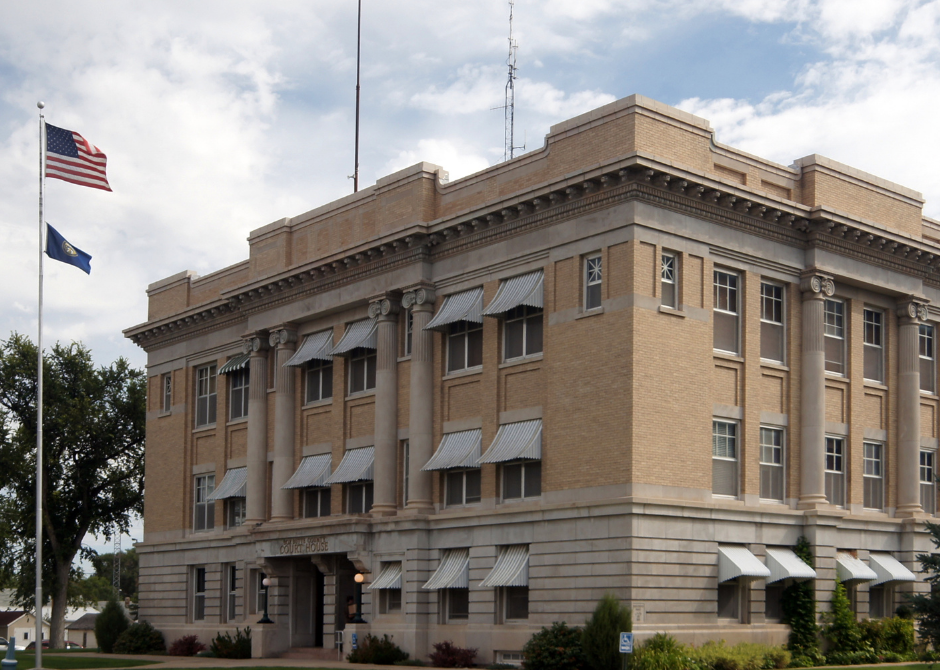
#42. Kings County
– Emergency shelters per 100K people: 18.4 (28 shelters in database)
– Emergency shelter capacity per 100K: 6,254,024 people (9,499,049 total capacity)
– Shelters with generators: 3
– Shelters in 100-year floodplain: 1
Canva
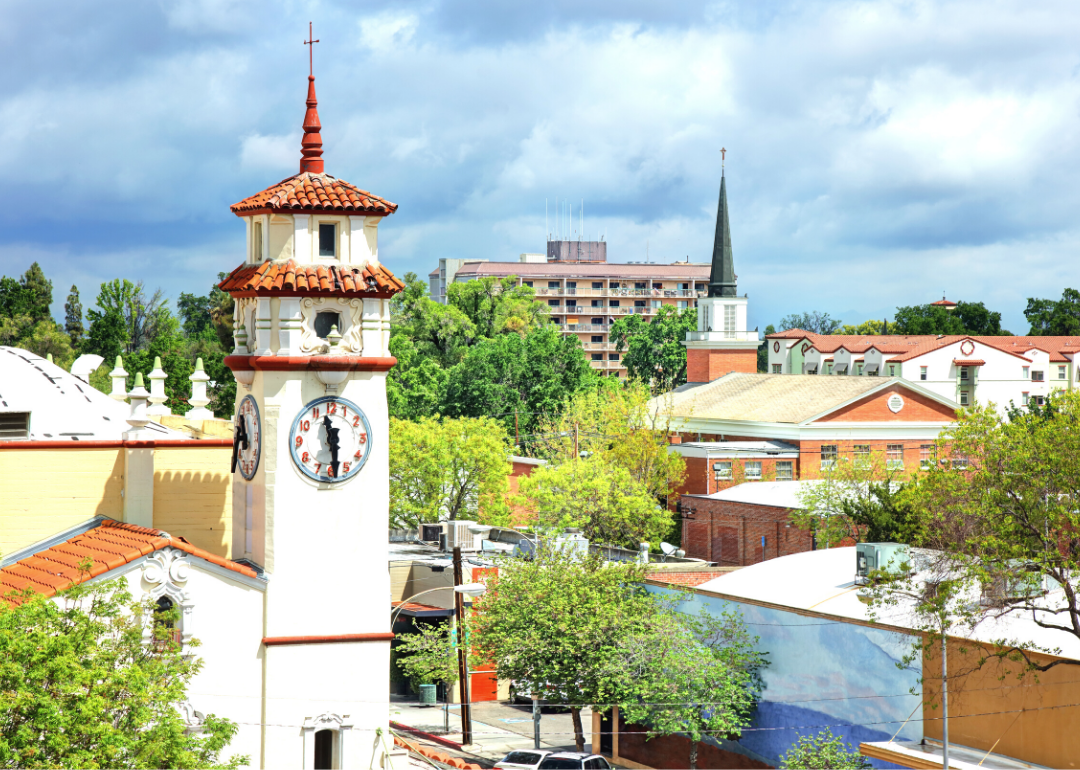
#41. Tulare County
– Emergency shelters per 100K people: 19.1 (90 shelters in database)
– Emergency shelter capacity per 100K: 6,556,244 people (30,879,842 total capacity)
– Shelters with generators: 3
– Shelters in 100-year floodplain: 1

Stan Shebs // Wikicommons
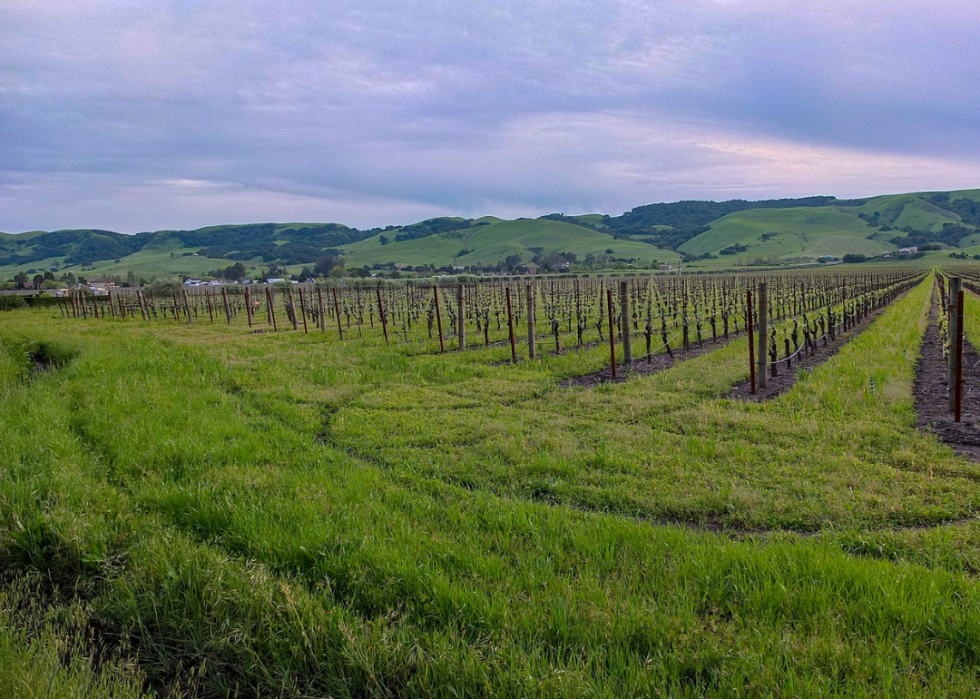
#40. Napa County
– Emergency shelters per 100K people: 19.5 (27 shelters in database)
– Emergency shelter capacity per 100K: 4,144,363 people (5,752,168 total capacity)
– Shelters with generators: 0
– Shelters in 100-year floodplain: 0
Jennifer Williams // Wikimedia Commons
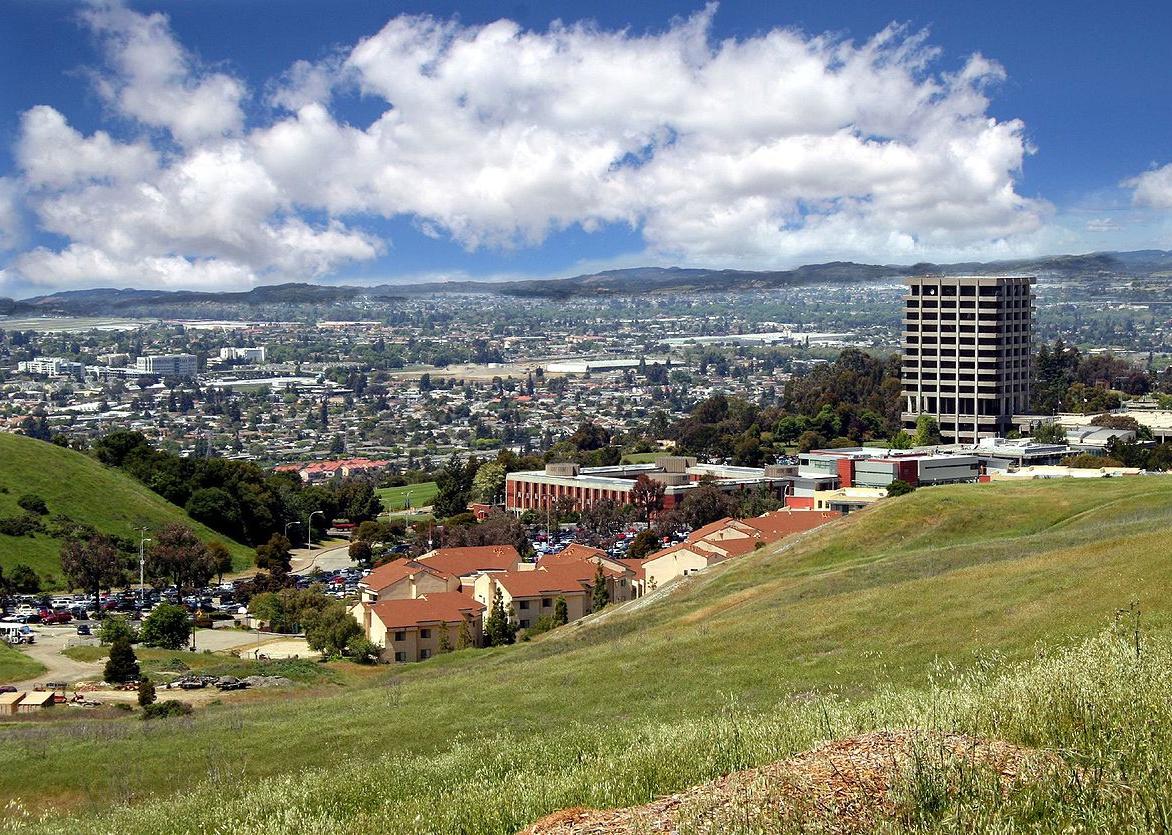
#39. Alameda County
– Emergency shelters per 100K people: 19.5 (326 shelters in database)
– Emergency shelter capacity per 100K: 4,288,247 people (71,748,068 total capacity)
– Shelters with generators: 15
– Shelters in 100-year floodplain: 16
Canva
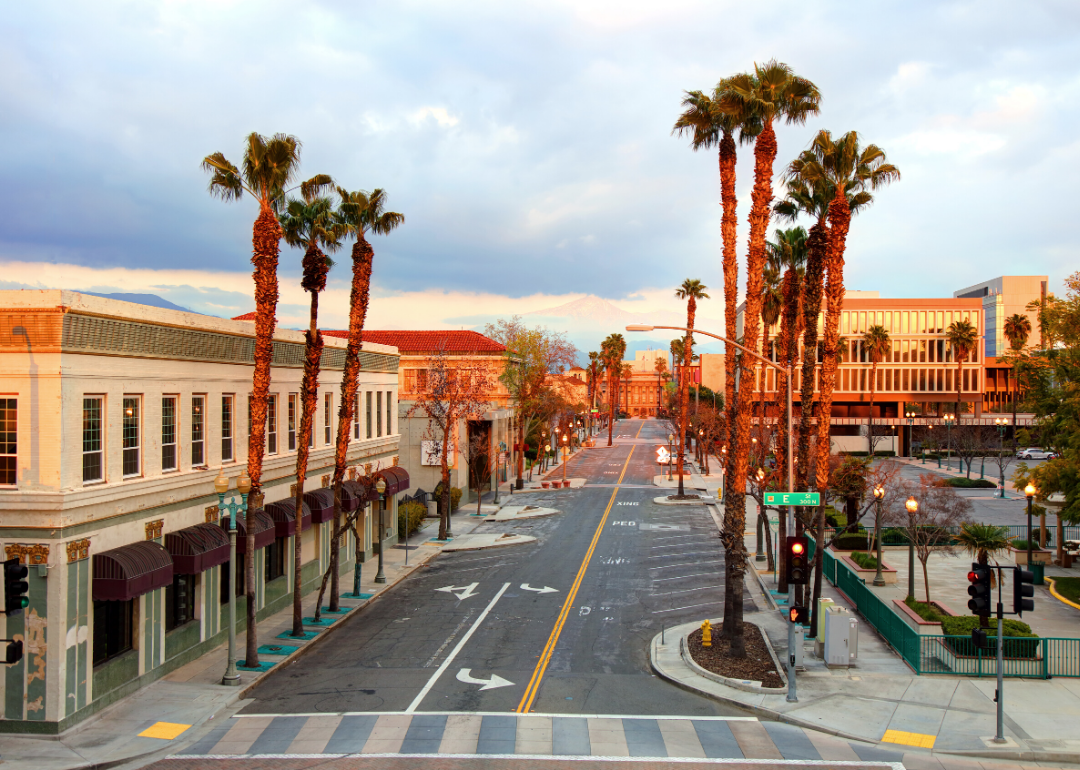
#38. San Bernardino County
– Emergency shelters per 100K people: 22.1 (480 shelters in database)
– Emergency shelter capacity per 100K: 5,521,335 people (119,872,109 total capacity)
– Shelters with generators: 48
– Shelters in 100-year floodplain: 1
Scott Burley // Wikimedia Commons
#37. Modoc County
– Emergency shelters per 100K people: 22.9 (2 shelters in database)
– Emergency shelter capacity per 100K: 8,249,203 people (719,578 total capacity)
– Shelters with generators: 0
– Shelters in 100-year floodplain: 0
Canva
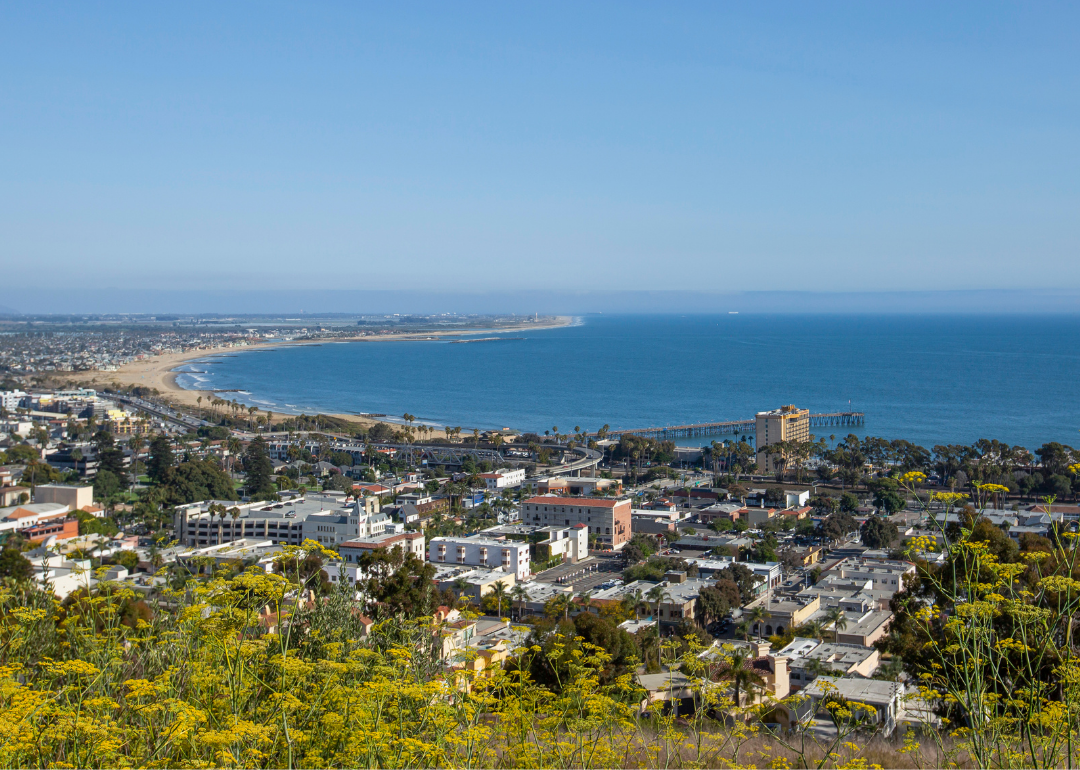
#36. Ventura County
– Emergency shelters per 100K people: 23.7 (200 shelters in database)
– Emergency shelter capacity per 100K: 6,083,904 people (51,424,504 total capacity)
– Shelters with generators: 6
– Shelters in 100-year floodplain: 5
MARELBU // Wikimedia Commons
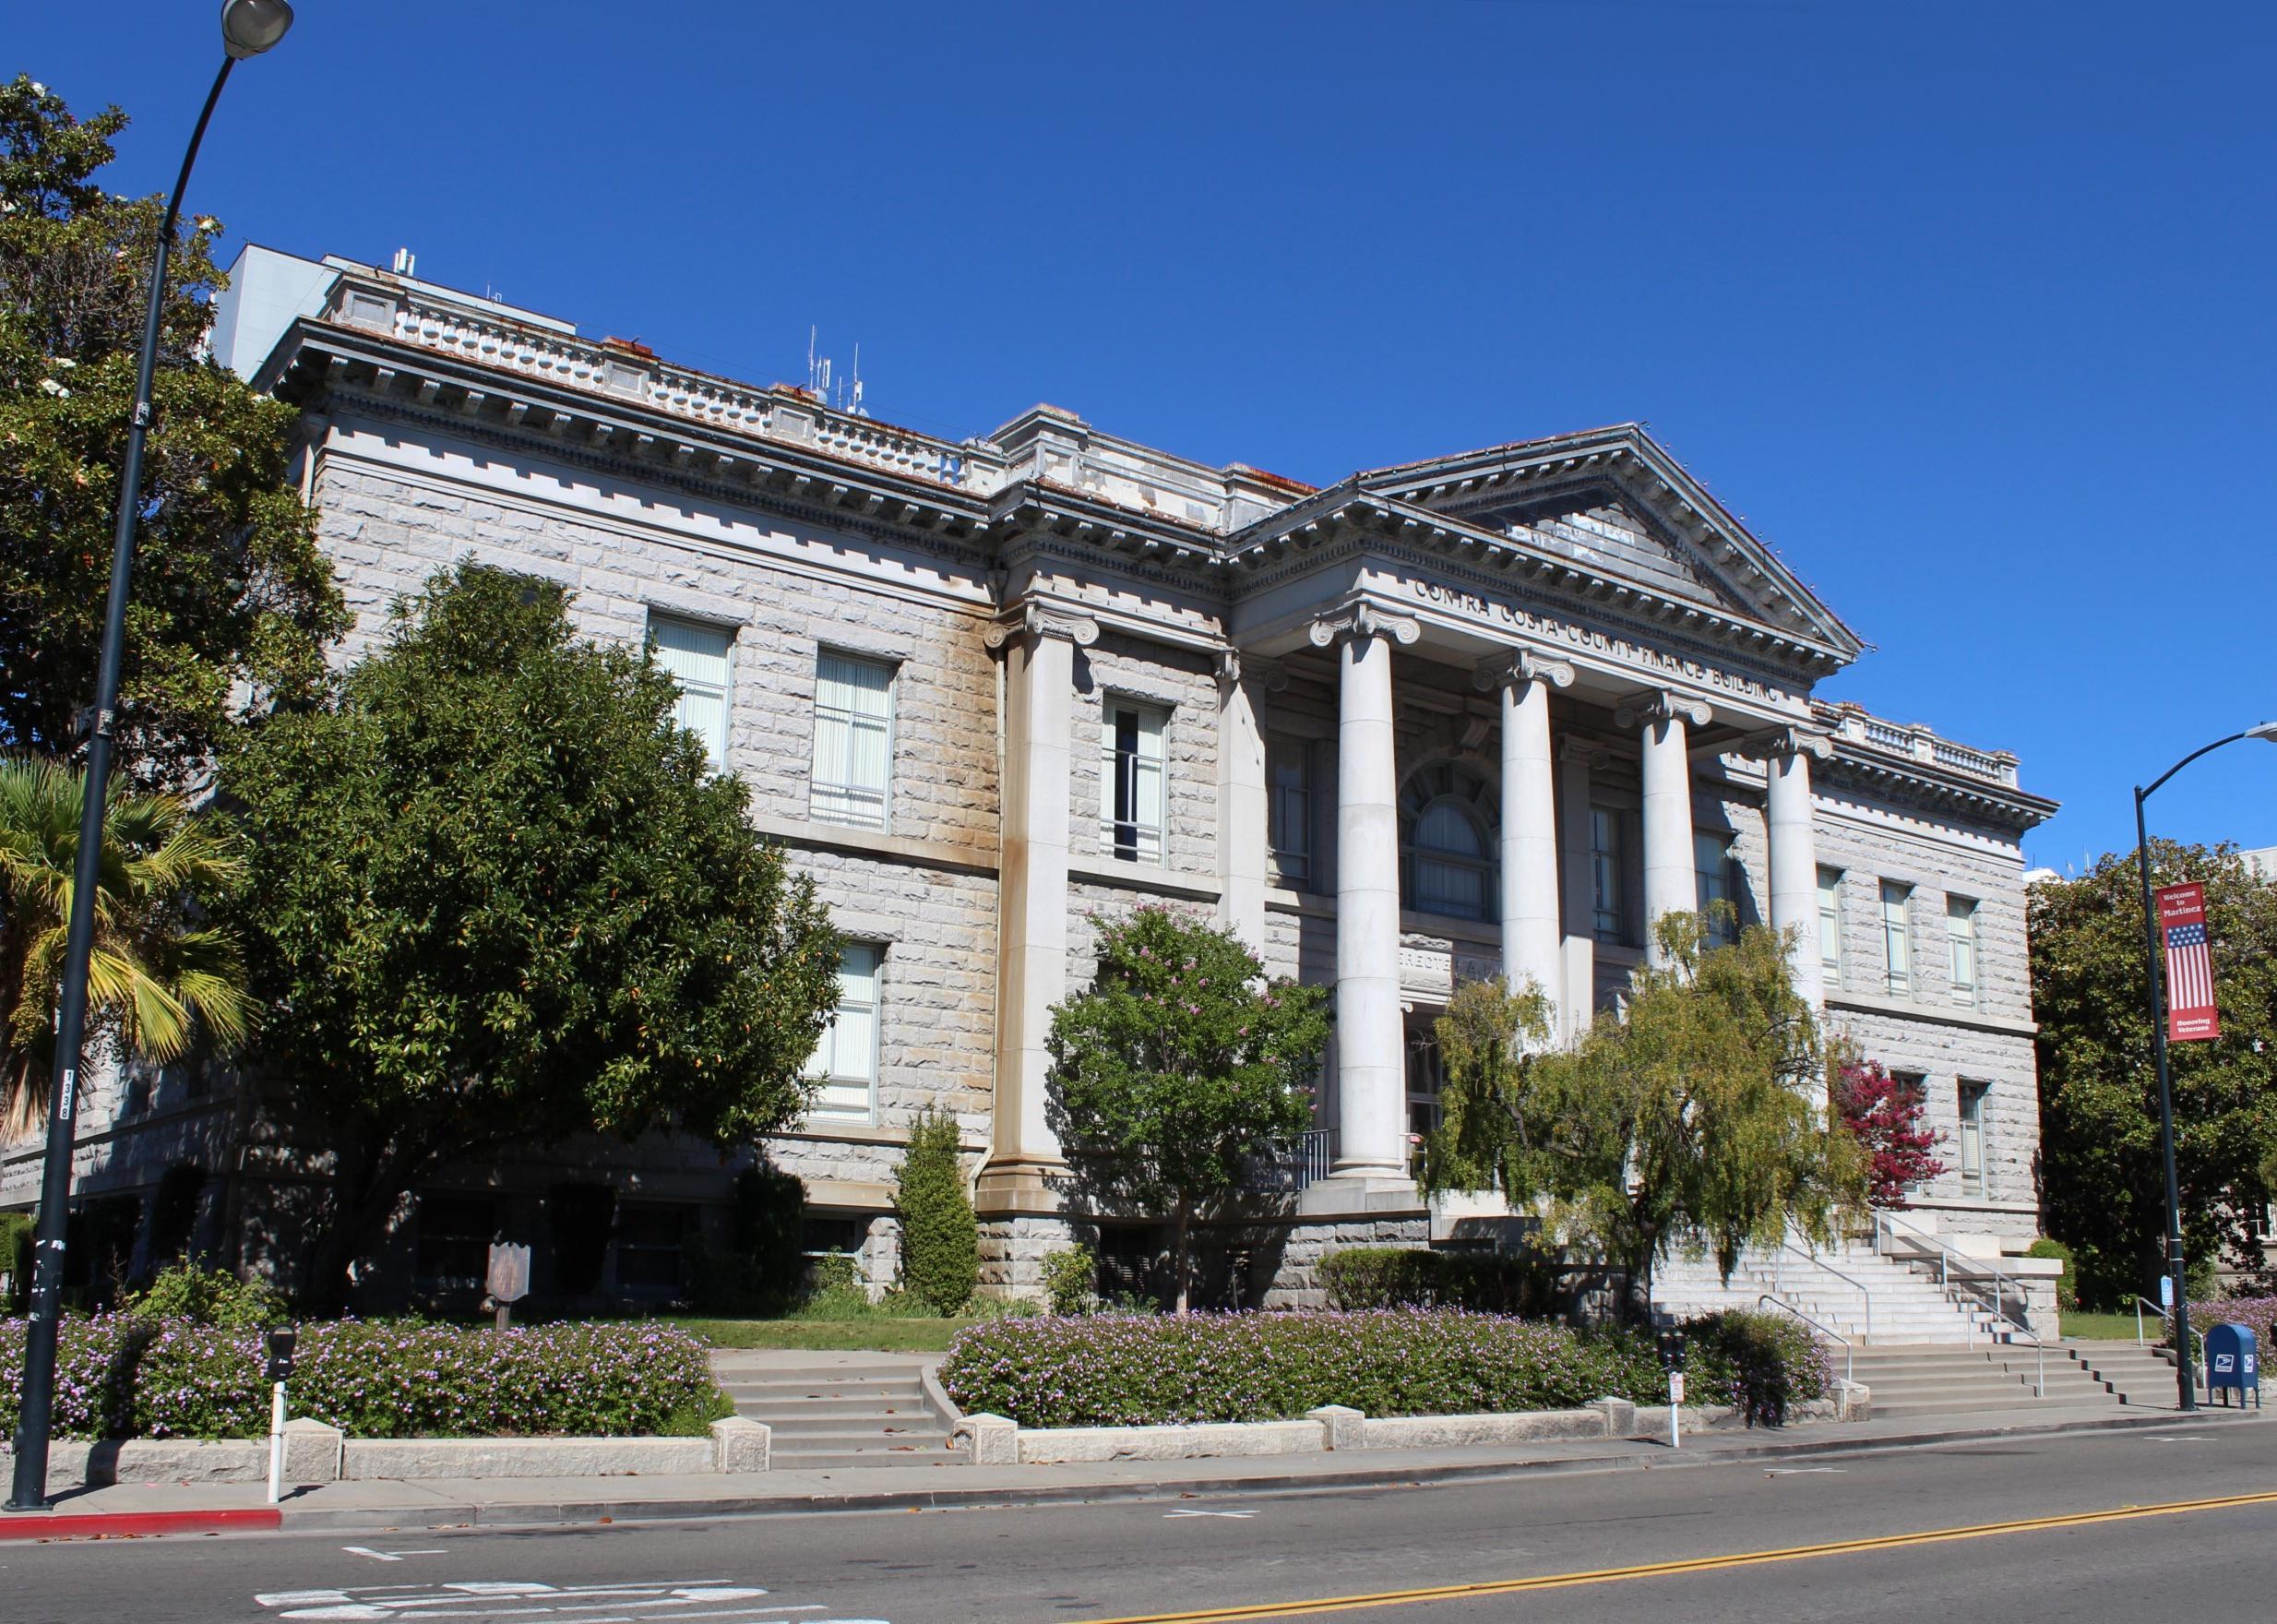
#35. Contra Costa County
– Emergency shelters per 100K people: 24.4 (284 shelters in database)
– Emergency shelter capacity per 100K: 6,017,555 people (69,902,505 total capacity)
– Shelters with generators: 0
– Shelters in 100-year floodplain: 0
Frank Schulenburg // Wikimedia Commons
#34. Tehama County
– Emergency shelters per 100K people: 24.5 (16 shelters in database)
– Emergency shelter capacity per 100K: 8,162,727 people (5,333,934 total capacity)
– Shelters with generators: 2
– Shelters in 100-year floodplain: 4

SD Dirk // Flickr
#33. San Diego County
– Emergency shelters per 100K people: 25.7 (847 shelters in database)
– Emergency shelter capacity per 100K: 5,119,047 people (168,740,028 total capacity)
– Shelters with generators: 6
– Shelters in 100-year floodplain: 3
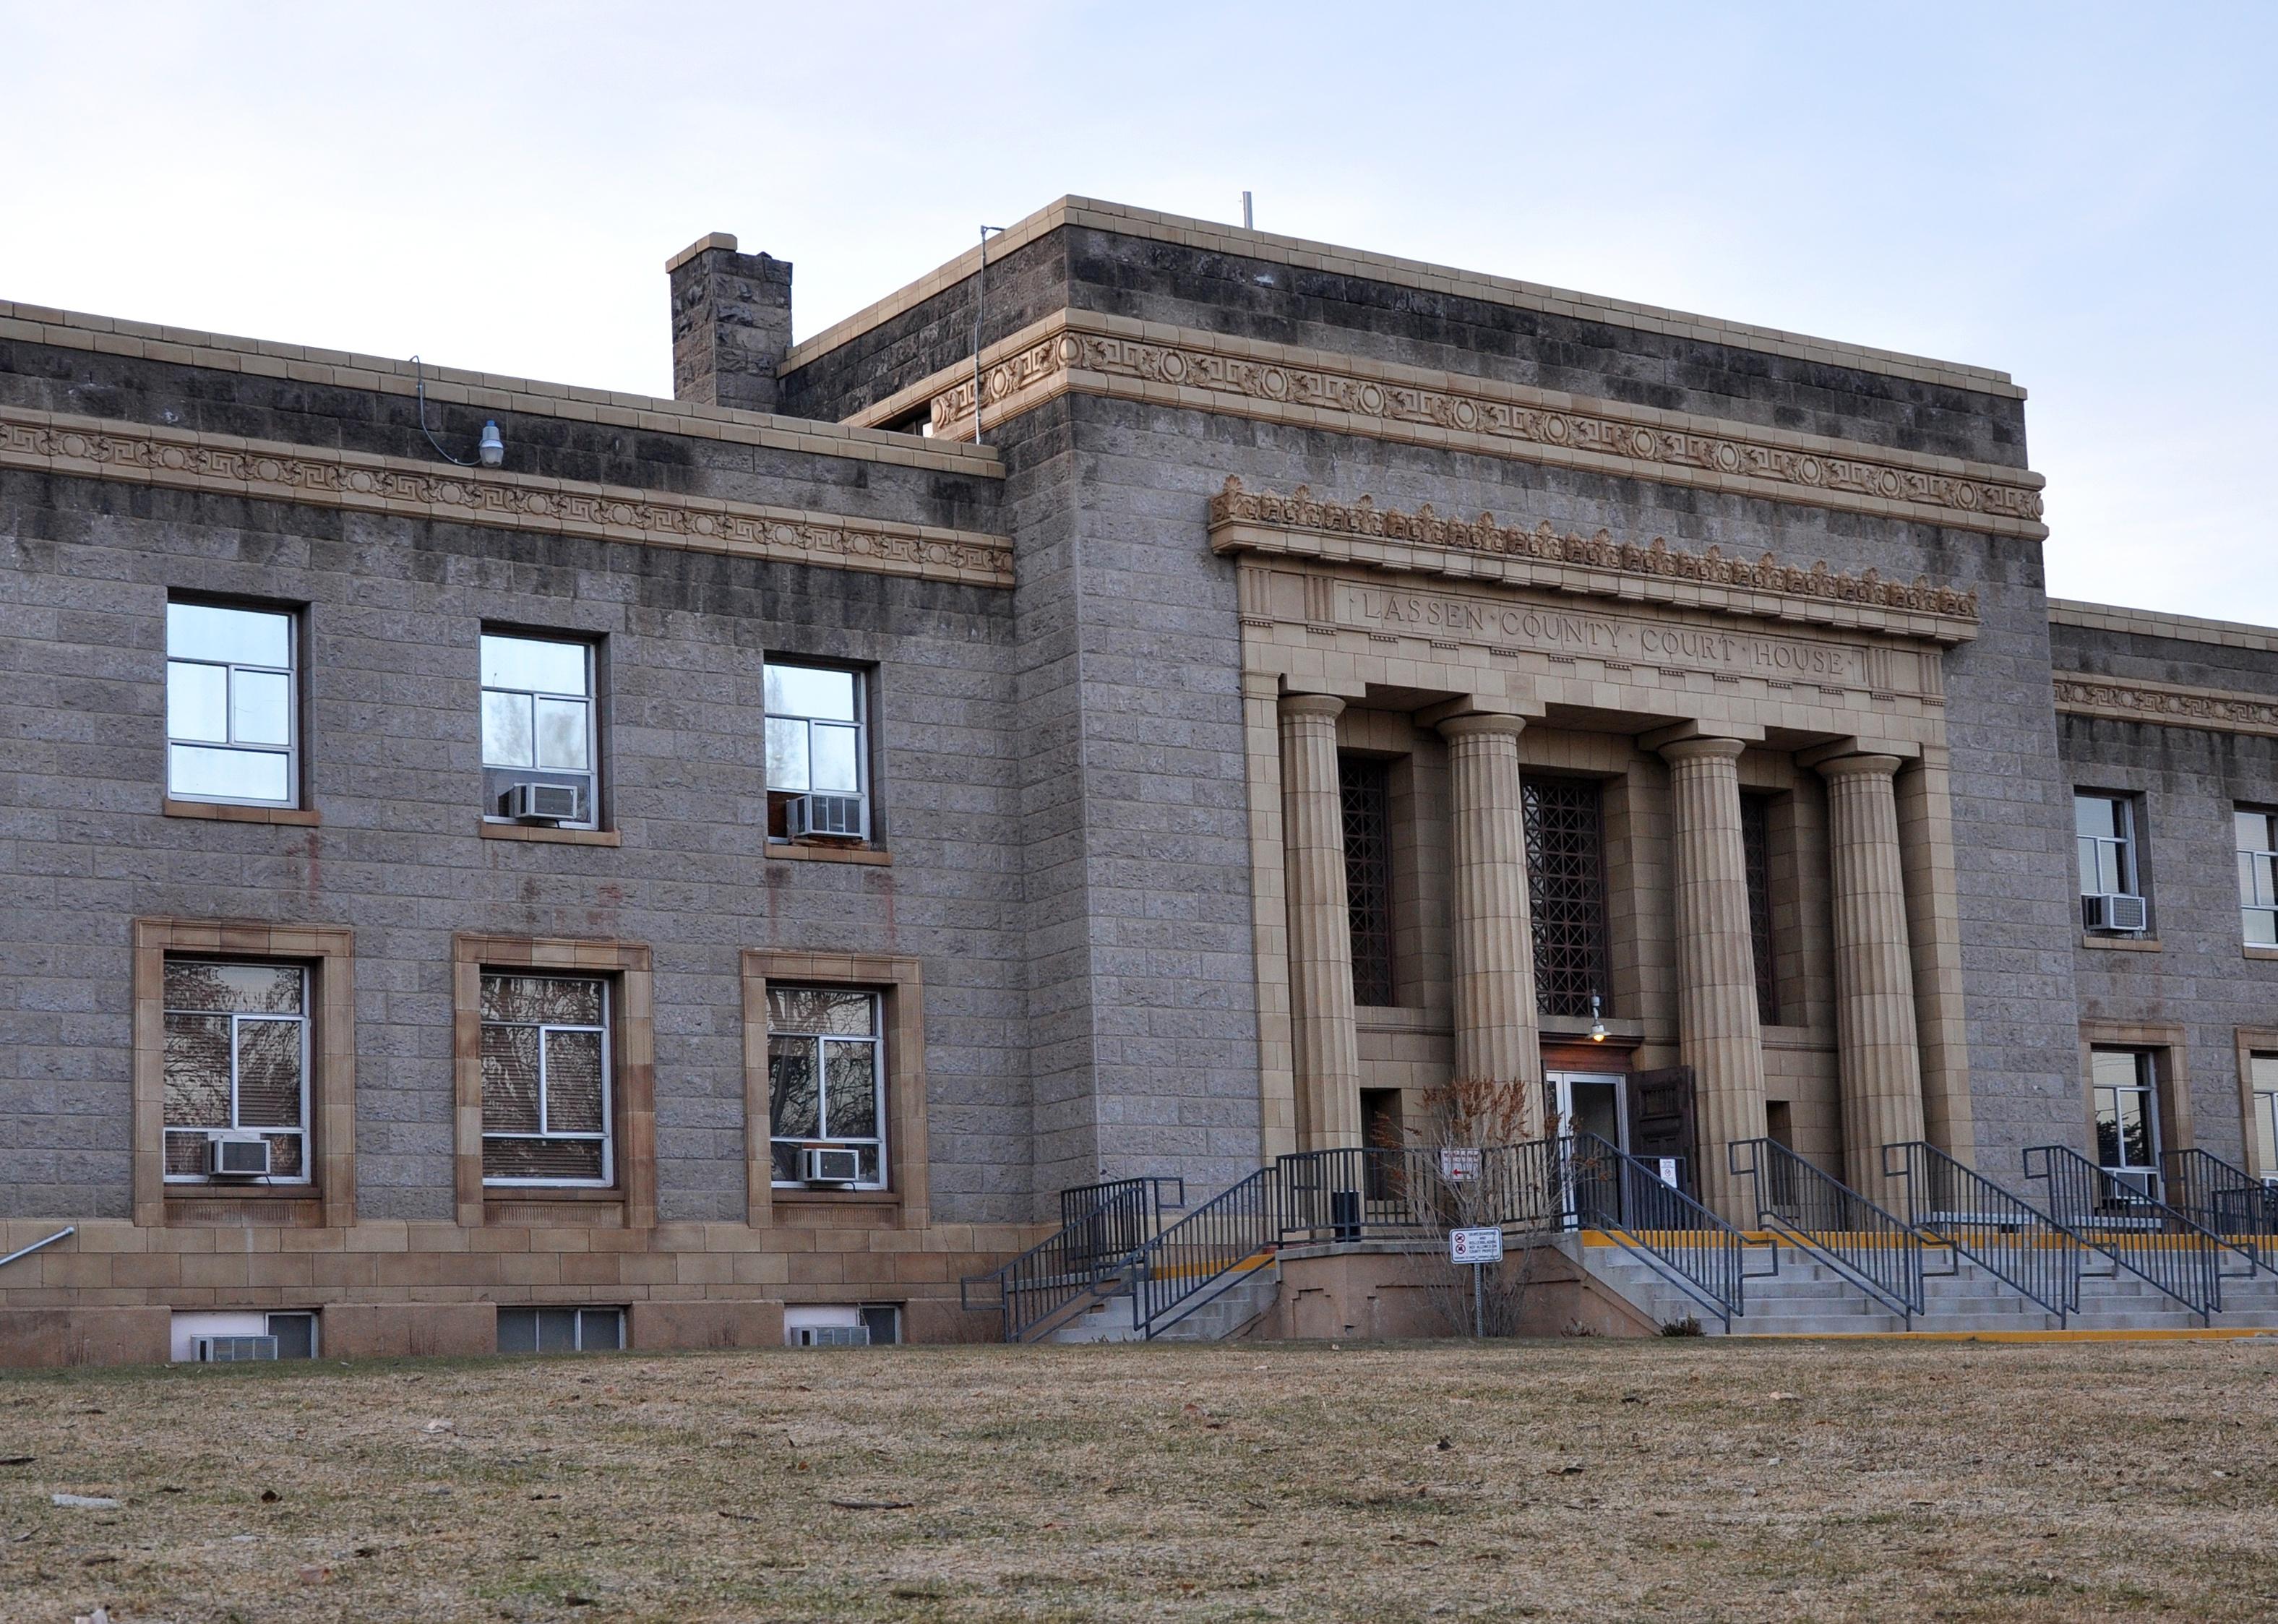
Finetooth // Wikimedia Commons
#32. Lassen County
– Emergency shelters per 100K people: 27.3 (9 shelters in database)
– Emergency shelter capacity per 100K: 7,425,112 people (2,446,500 total capacity)
– Shelters with generators: 0
– Shelters in 100-year floodplain: 0
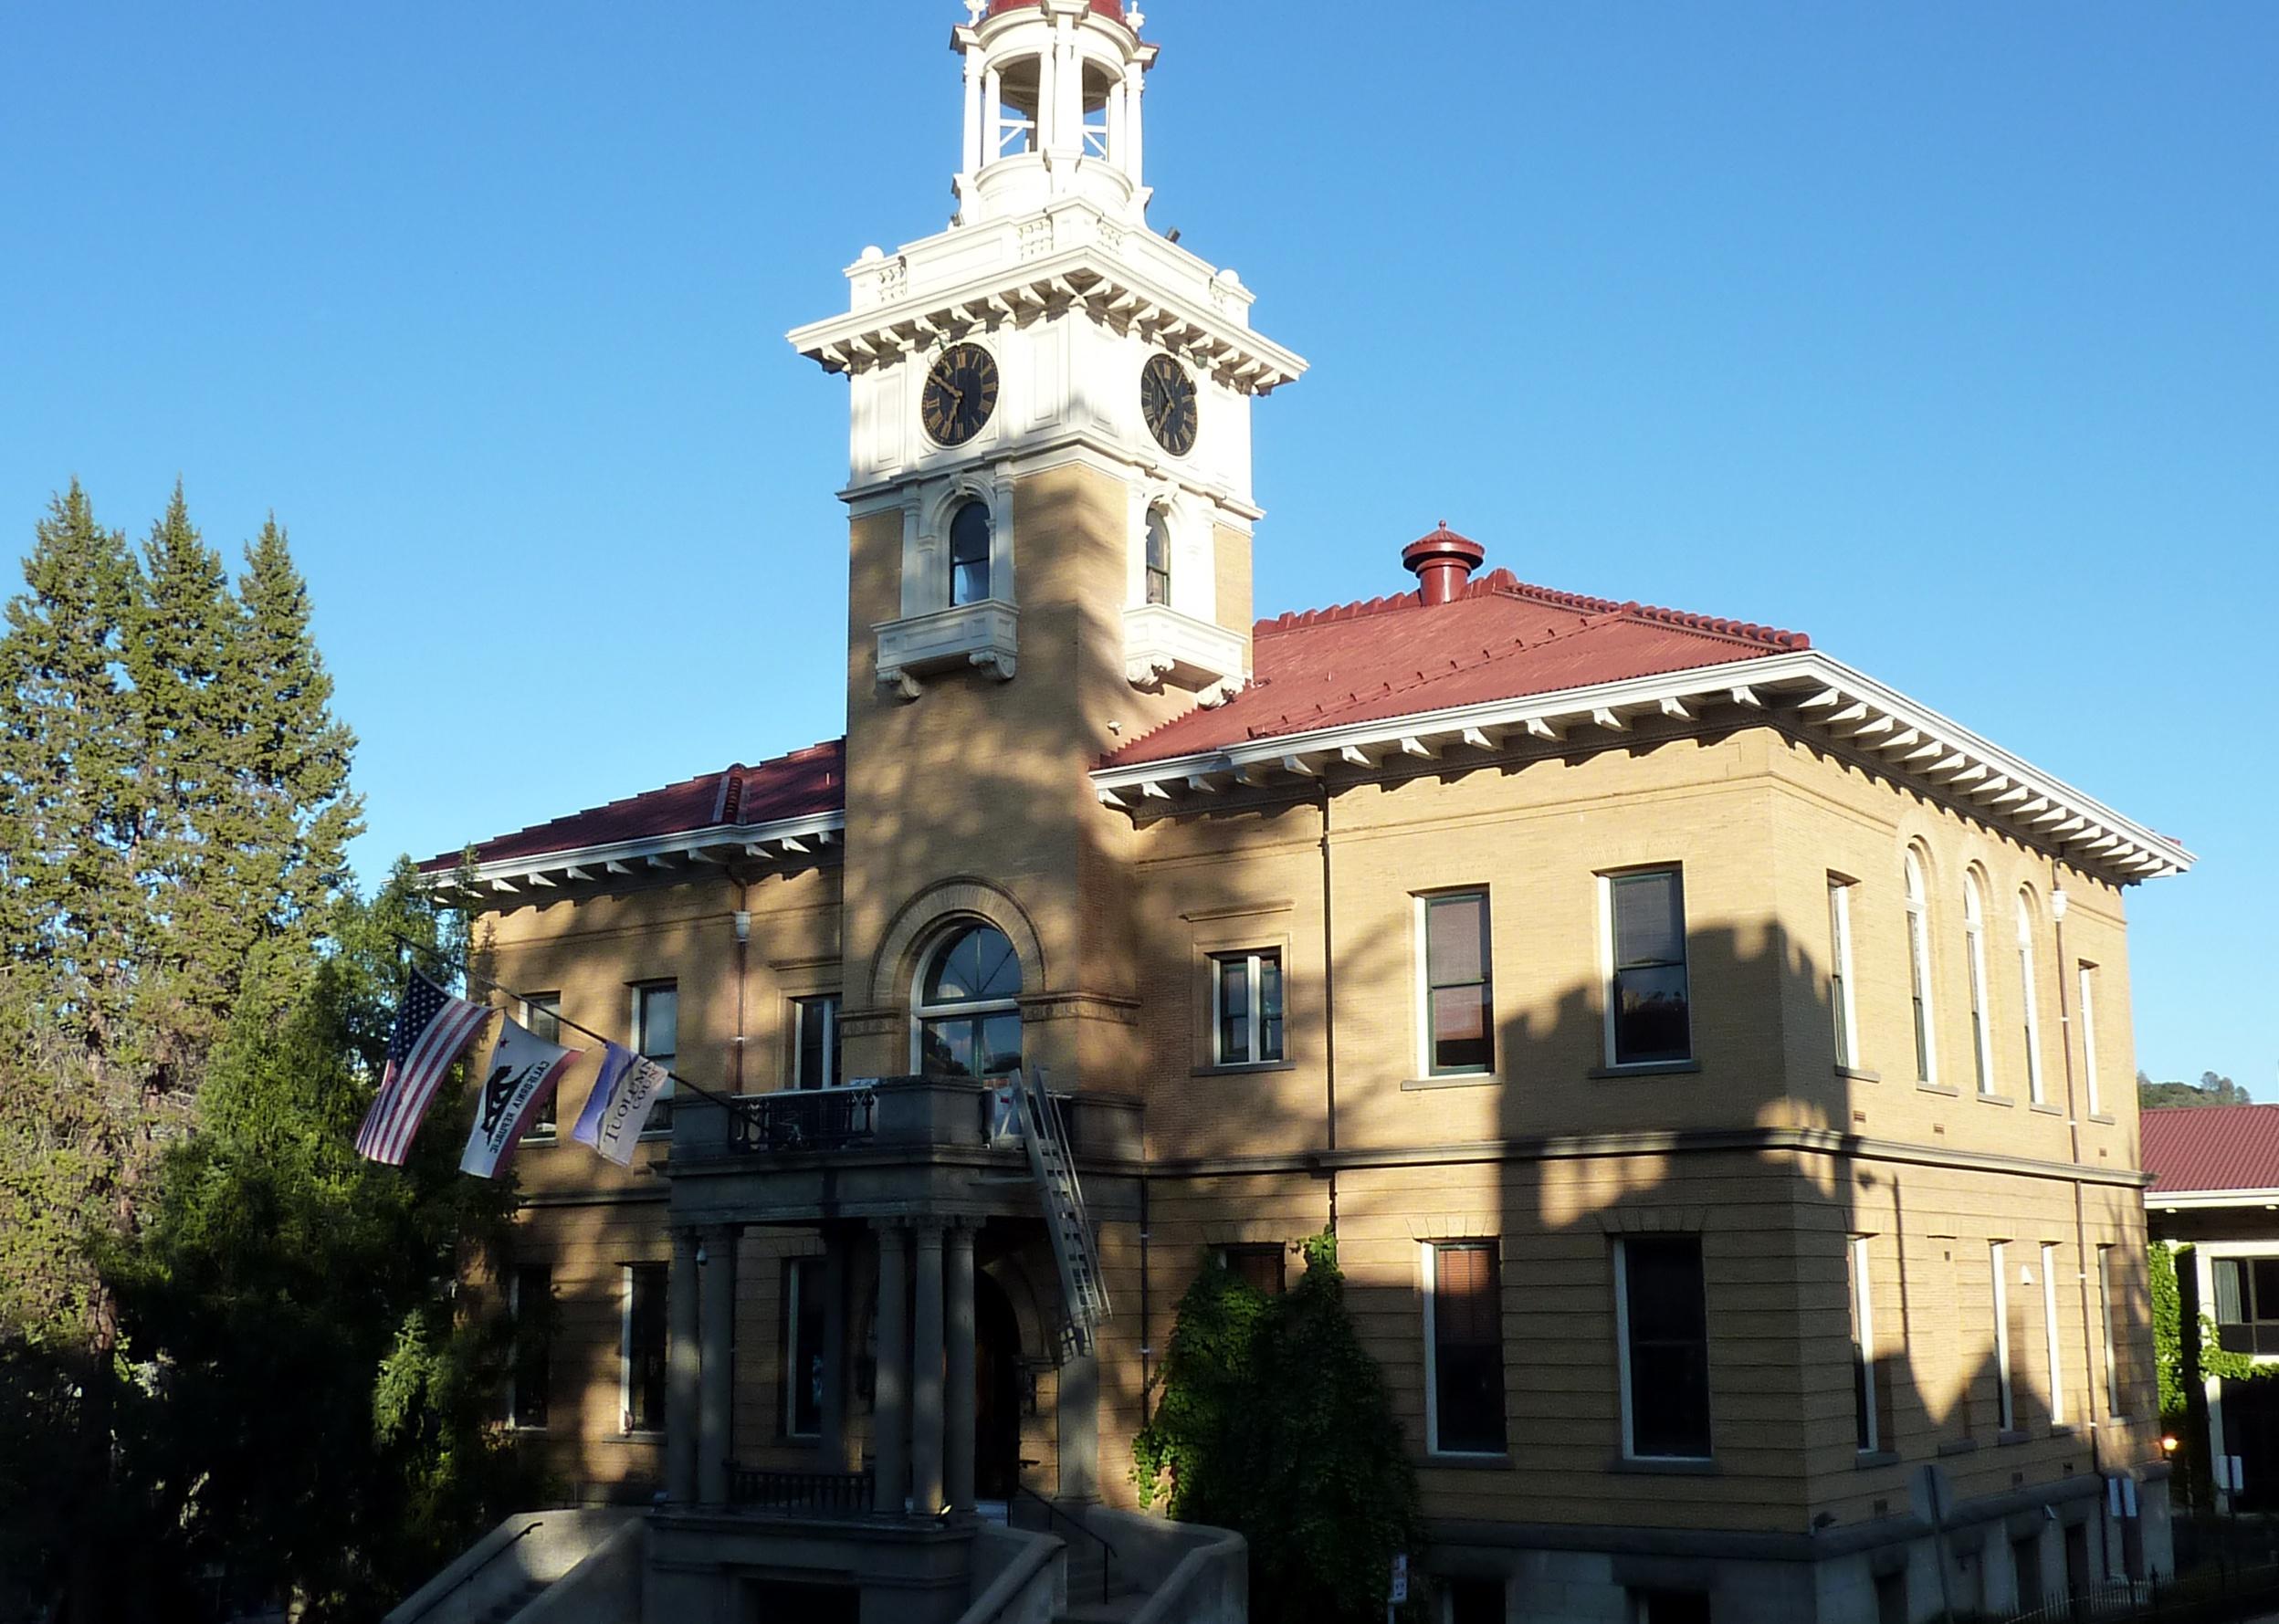
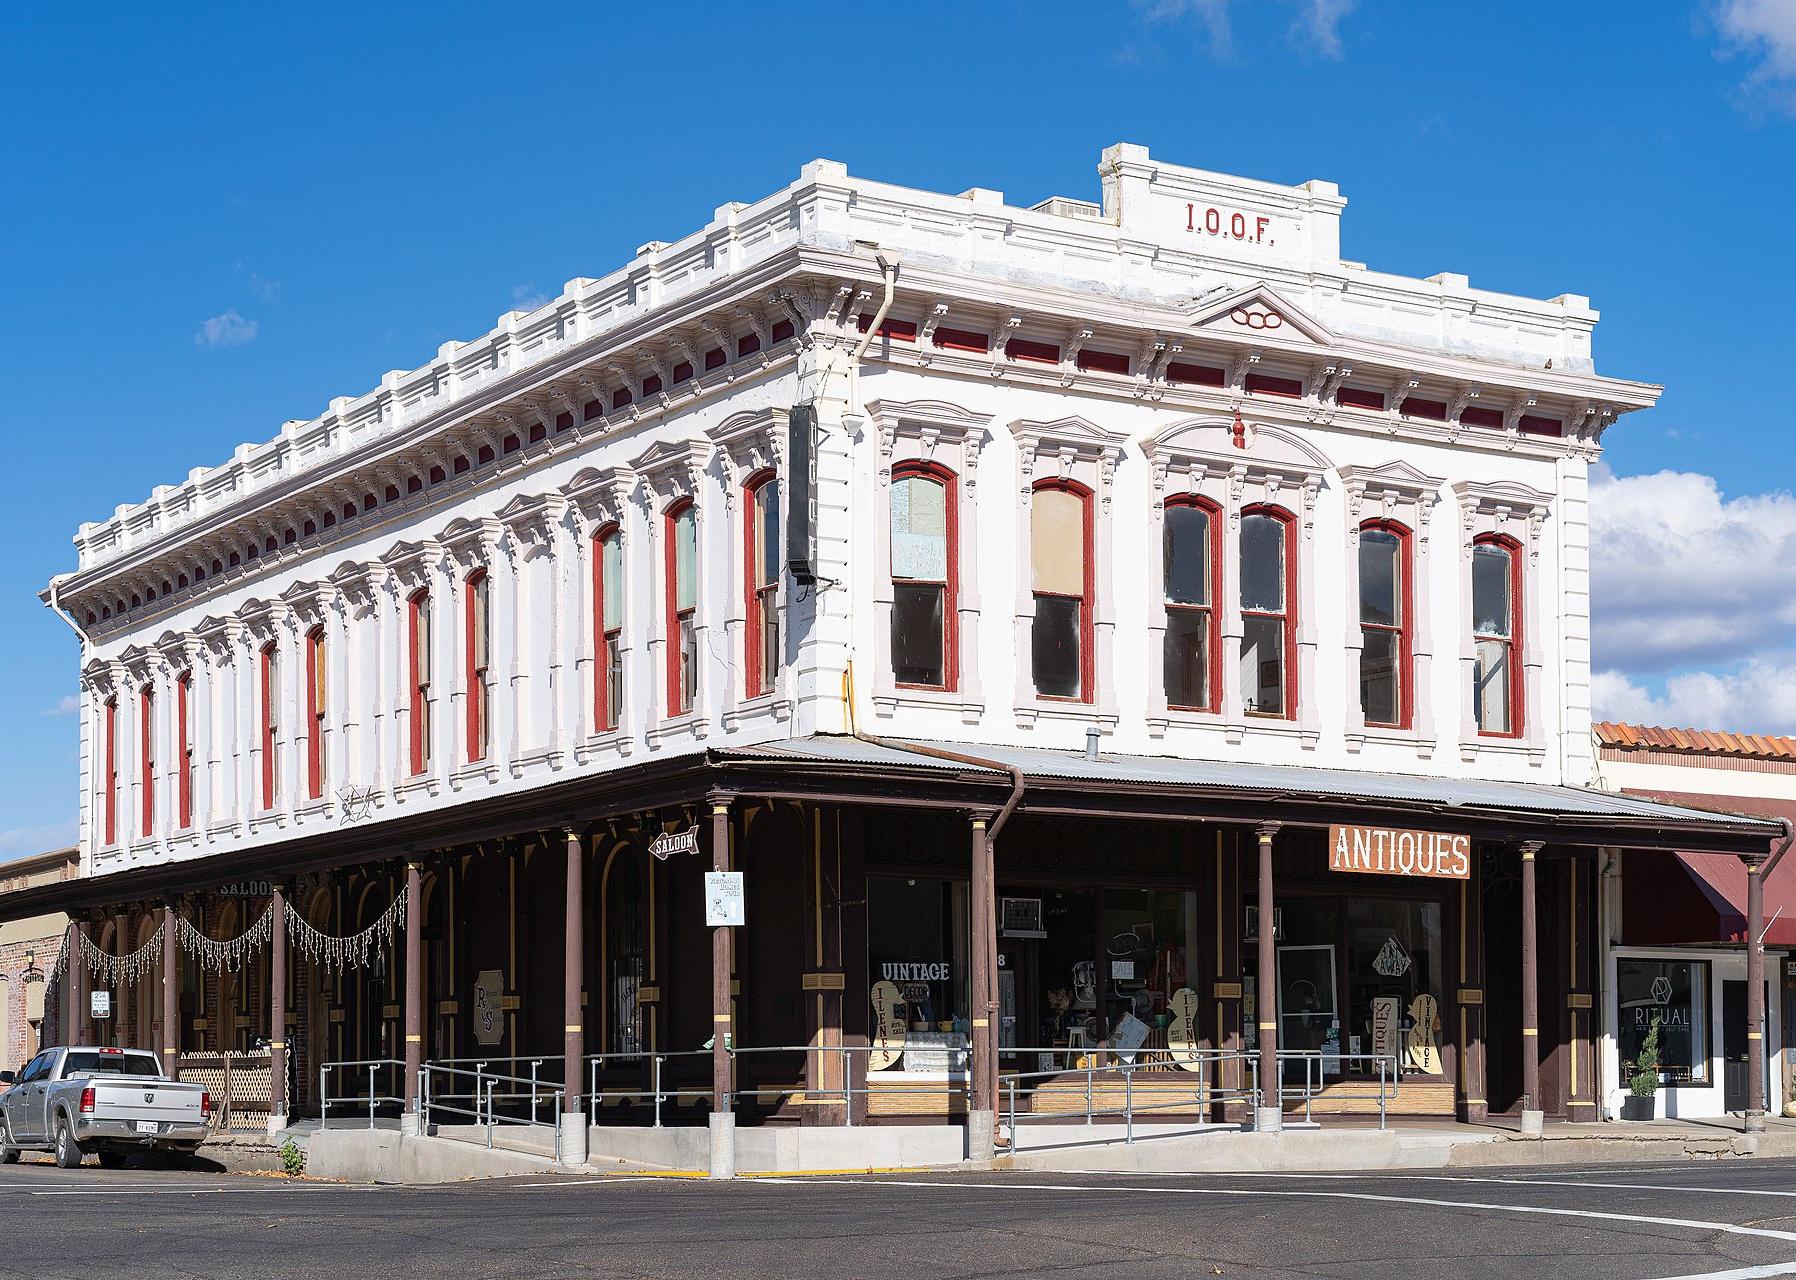
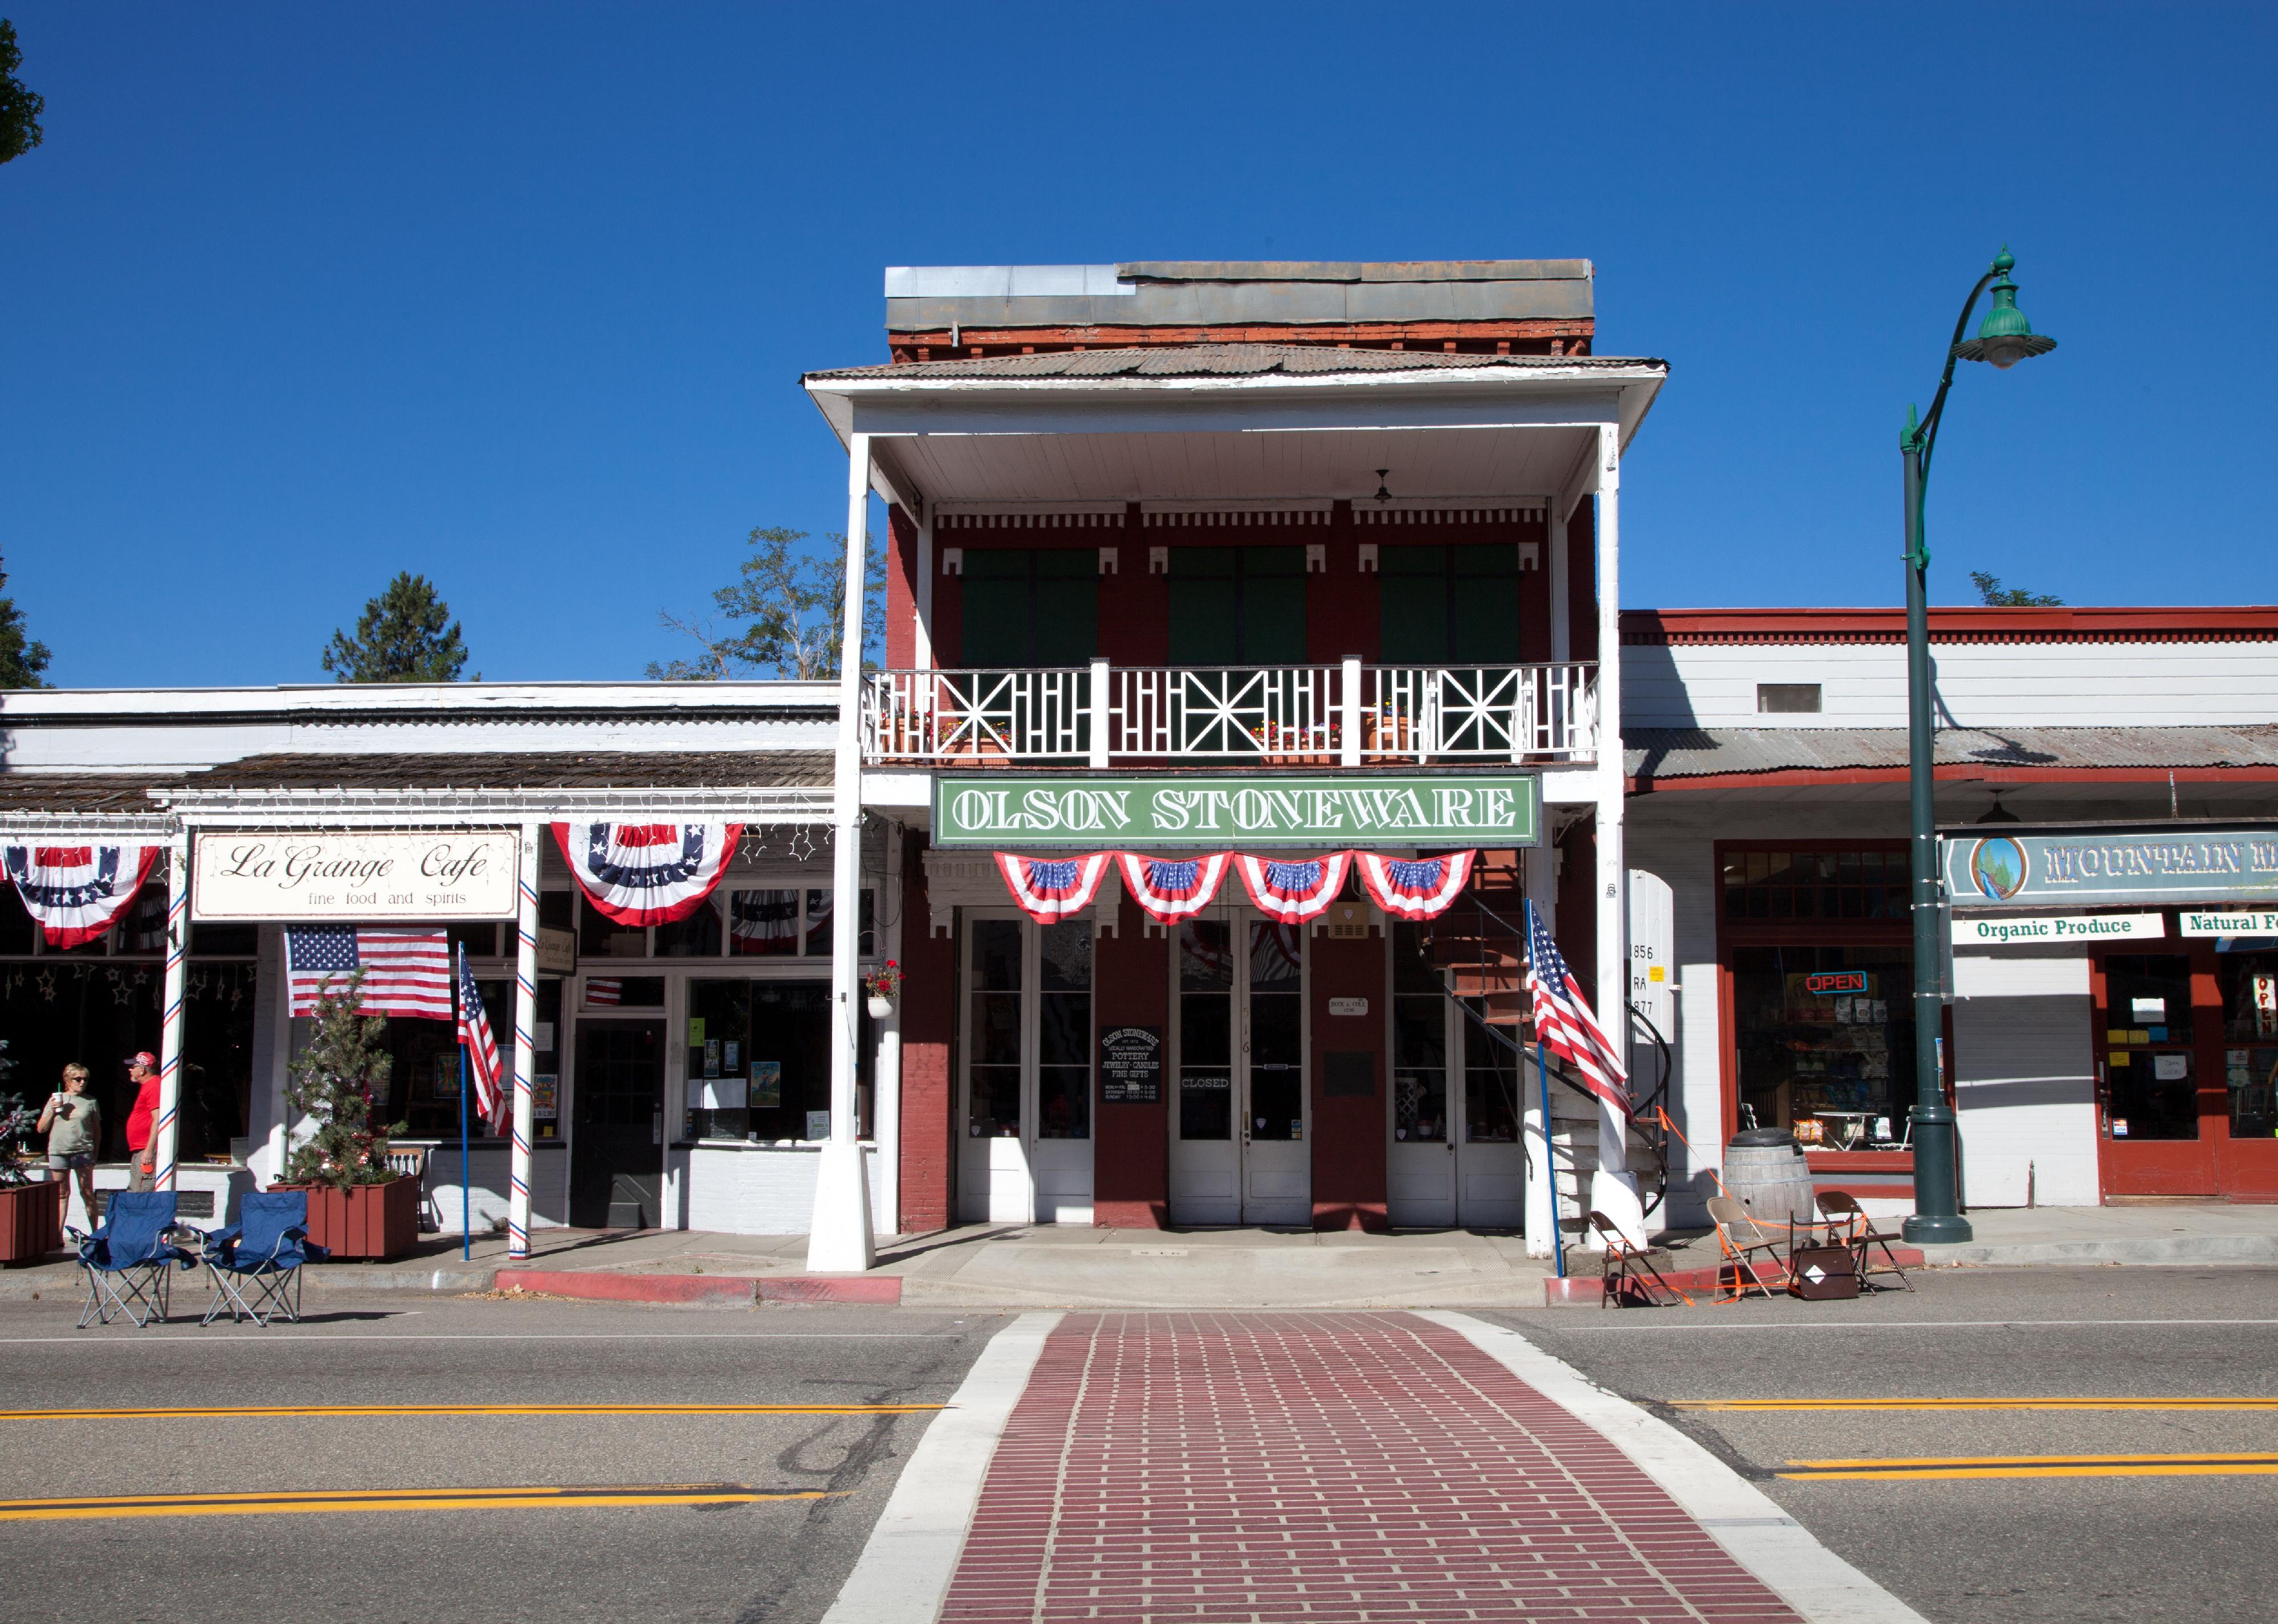
Bobak Ha’Eri // Wikimedia Commons
#31. Tuolumne County
– Emergency shelters per 100K people: 29.0 (16 shelters in database)
– Emergency shelter capacity per 100K: 10,038,684 people (5,545,670 total capacity)
– Shelters with generators: 3
– Shelters in 100-year floodplain: 0
Public Domain
#30. Madera County
– Emergency shelters per 100K people: 30.7 (48 shelters in database)
– Emergency shelter capacity per 100K: 8,743,879 people (13,667,032 total capacity)
– Shelters with generators: 1
– Shelters in 100-year floodplain: 0
Craig Howell // Wikimedia Commons
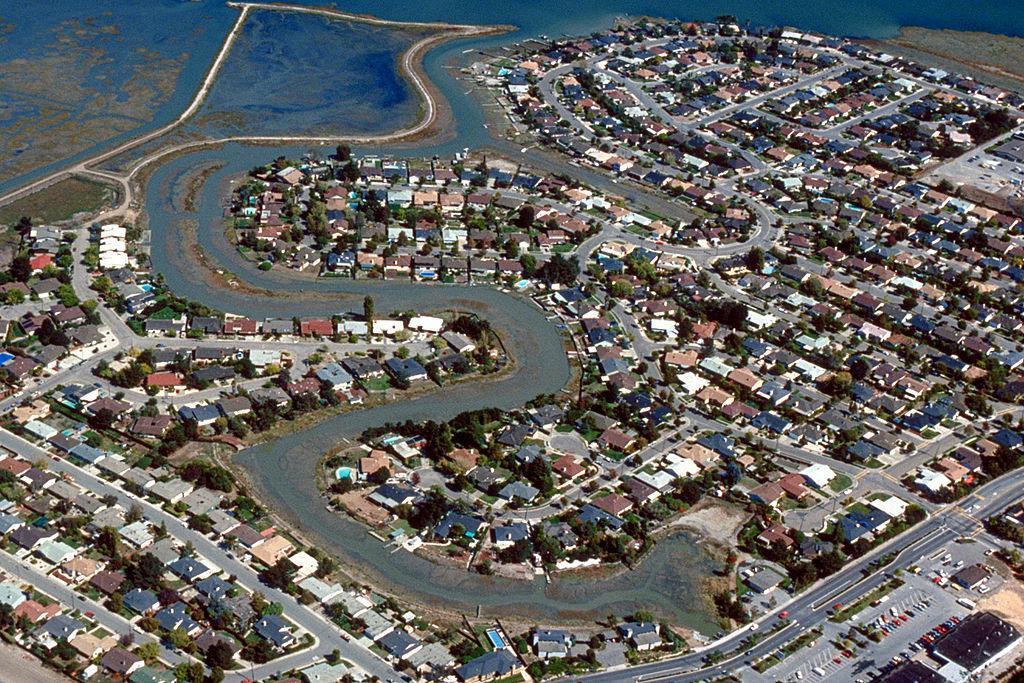
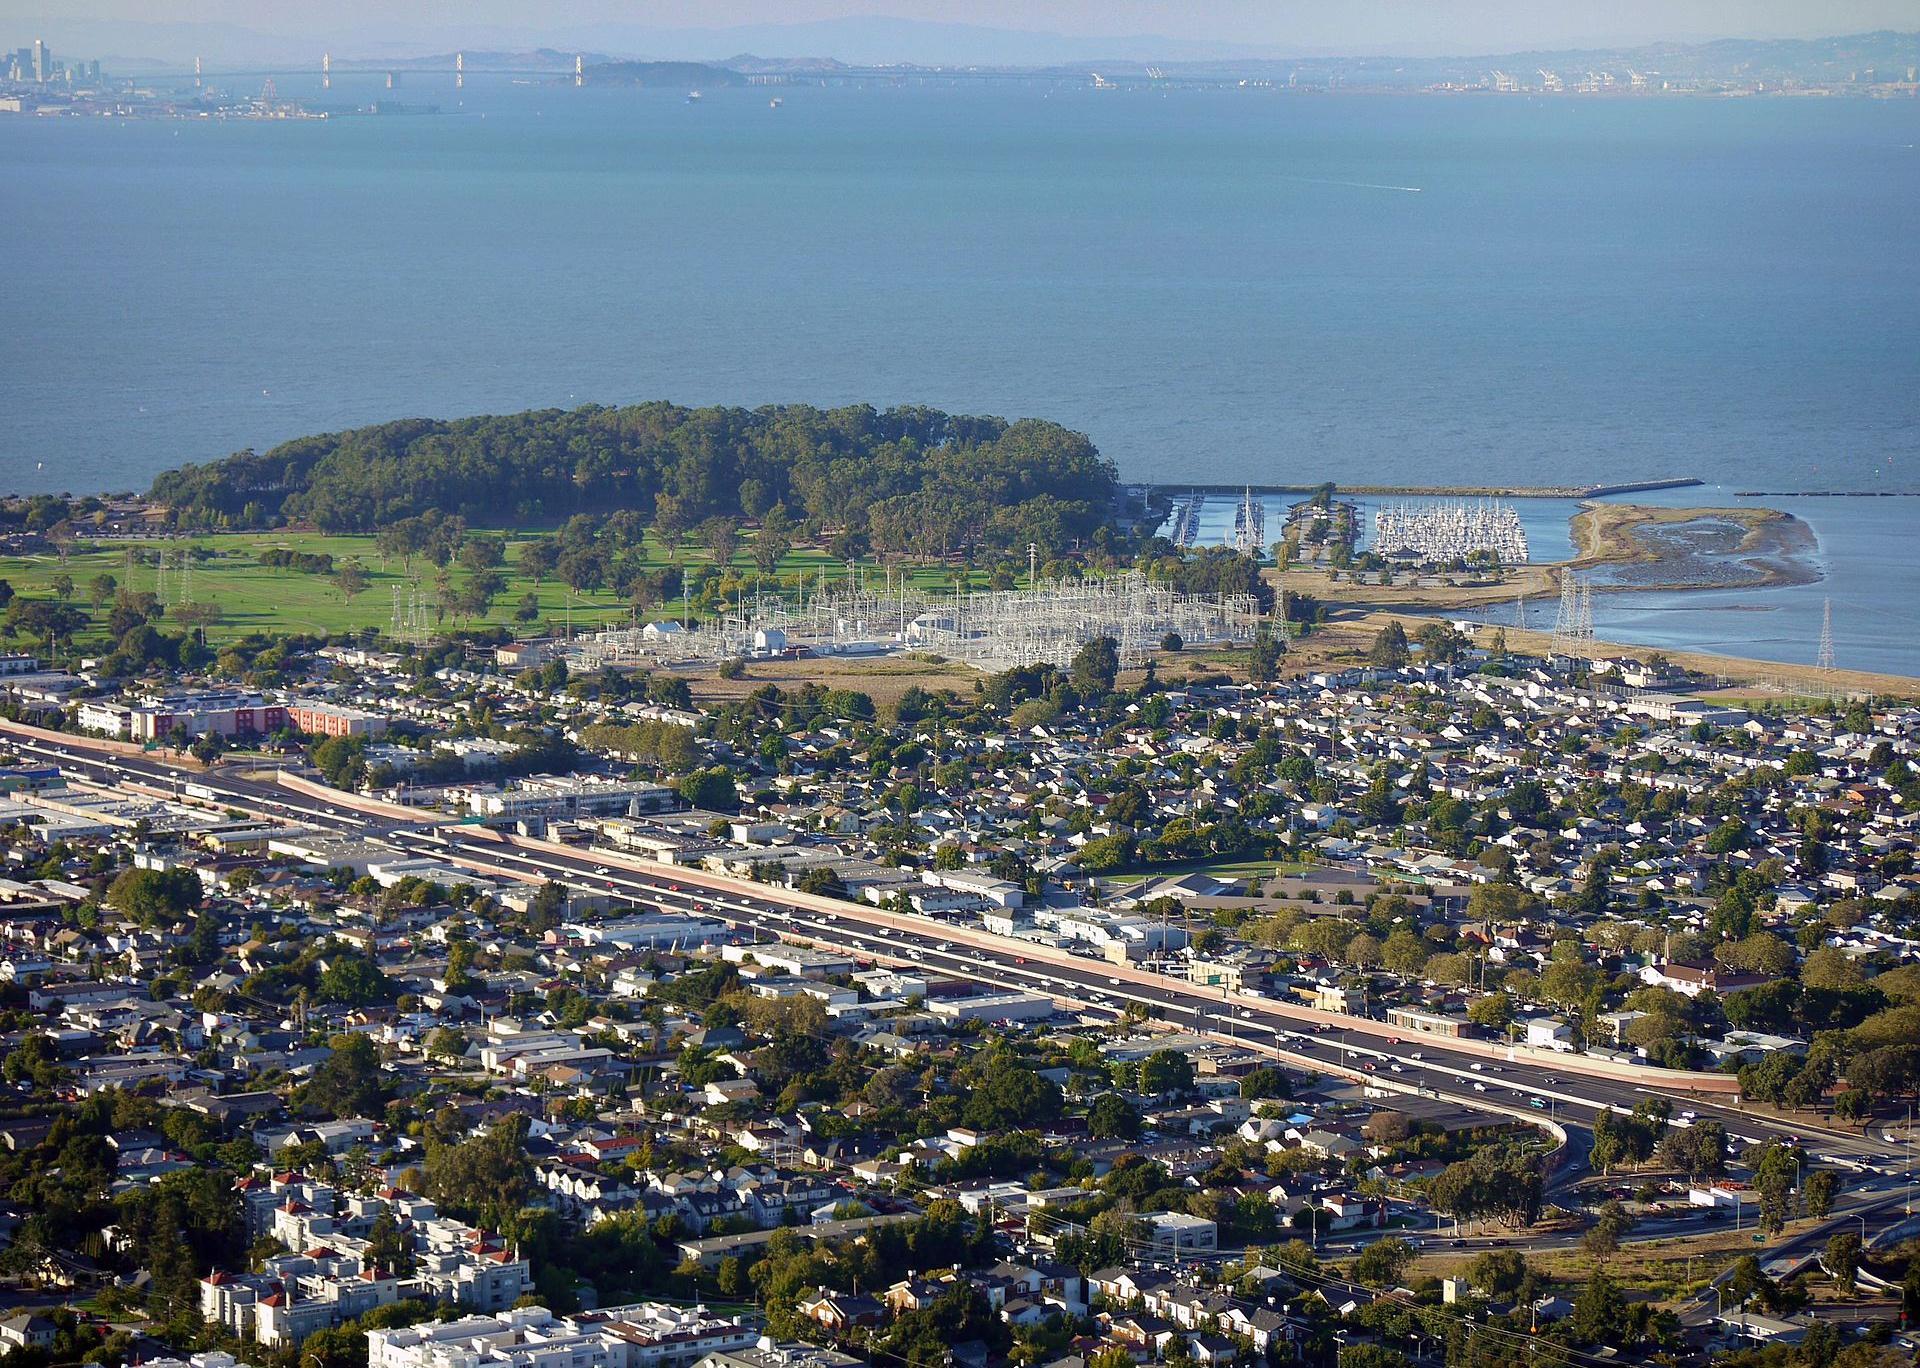
#29. San Mateo County
– Emergency shelters per 100K people: 32.0 (244 shelters in database)
– Emergency shelter capacity per 100K: 7,055,652 people (53,798,500 total capacity)
– Shelters with generators: 14
– Shelters in 100-year floodplain: 4
Calilover // Wikimedia Commons
#28. Monterey County
– Emergency shelters per 100K people: 33.0 (145 shelters in database)
– Emergency shelter capacity per 100K: 6,536,694 people (28,693,014 total capacity)
– Shelters with generators: 3
– Shelters in 100-year floodplain: 4
Basar // Wikicommons
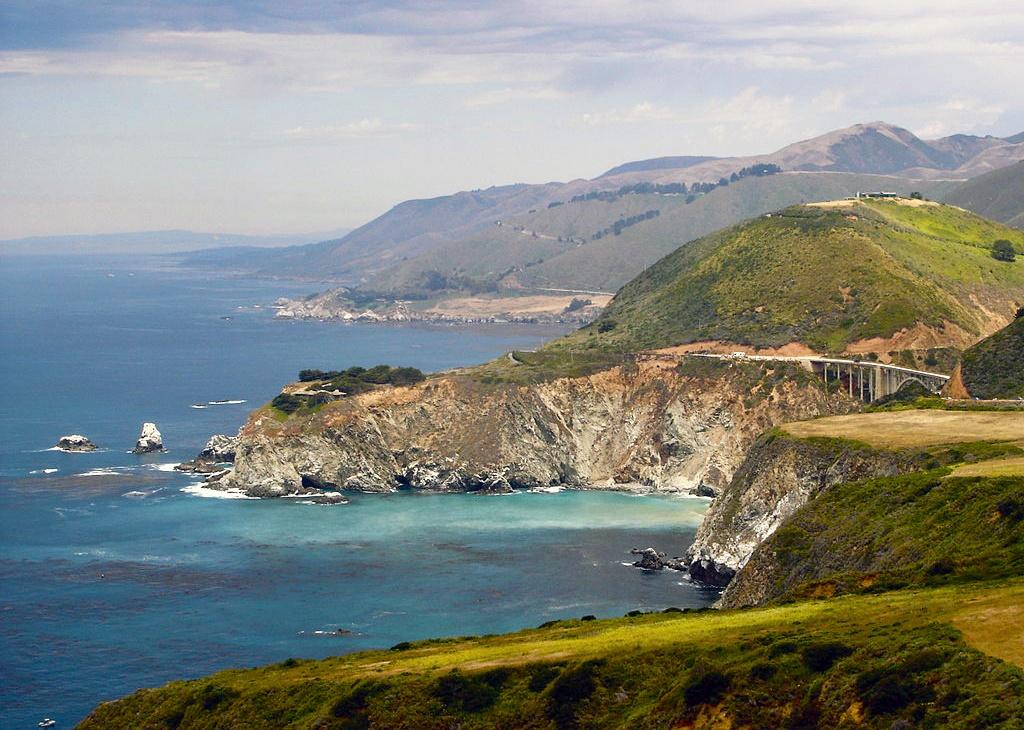
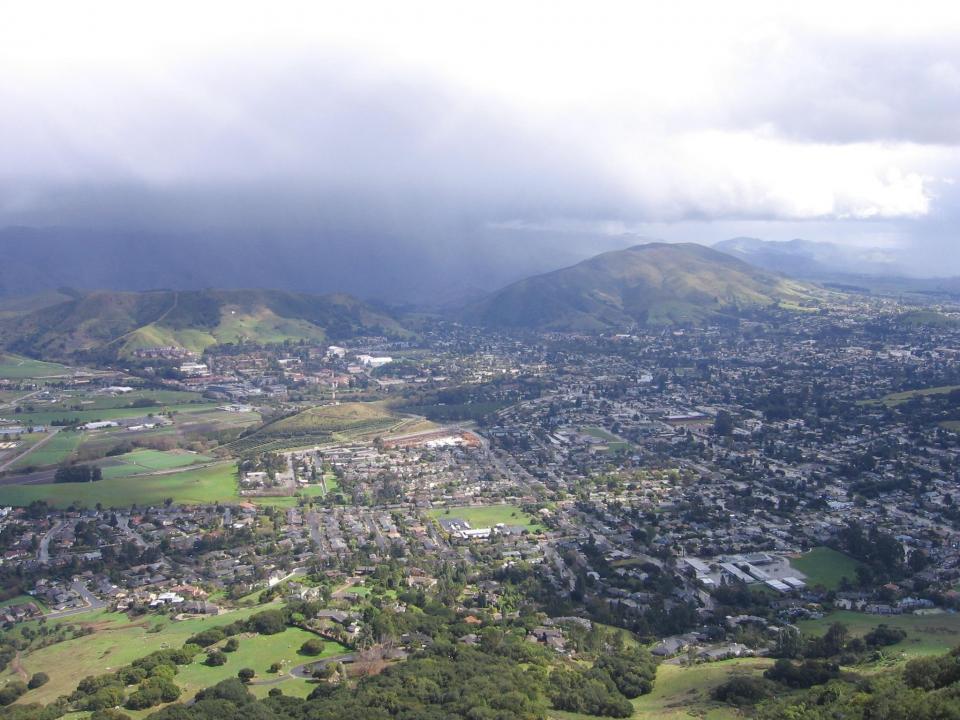
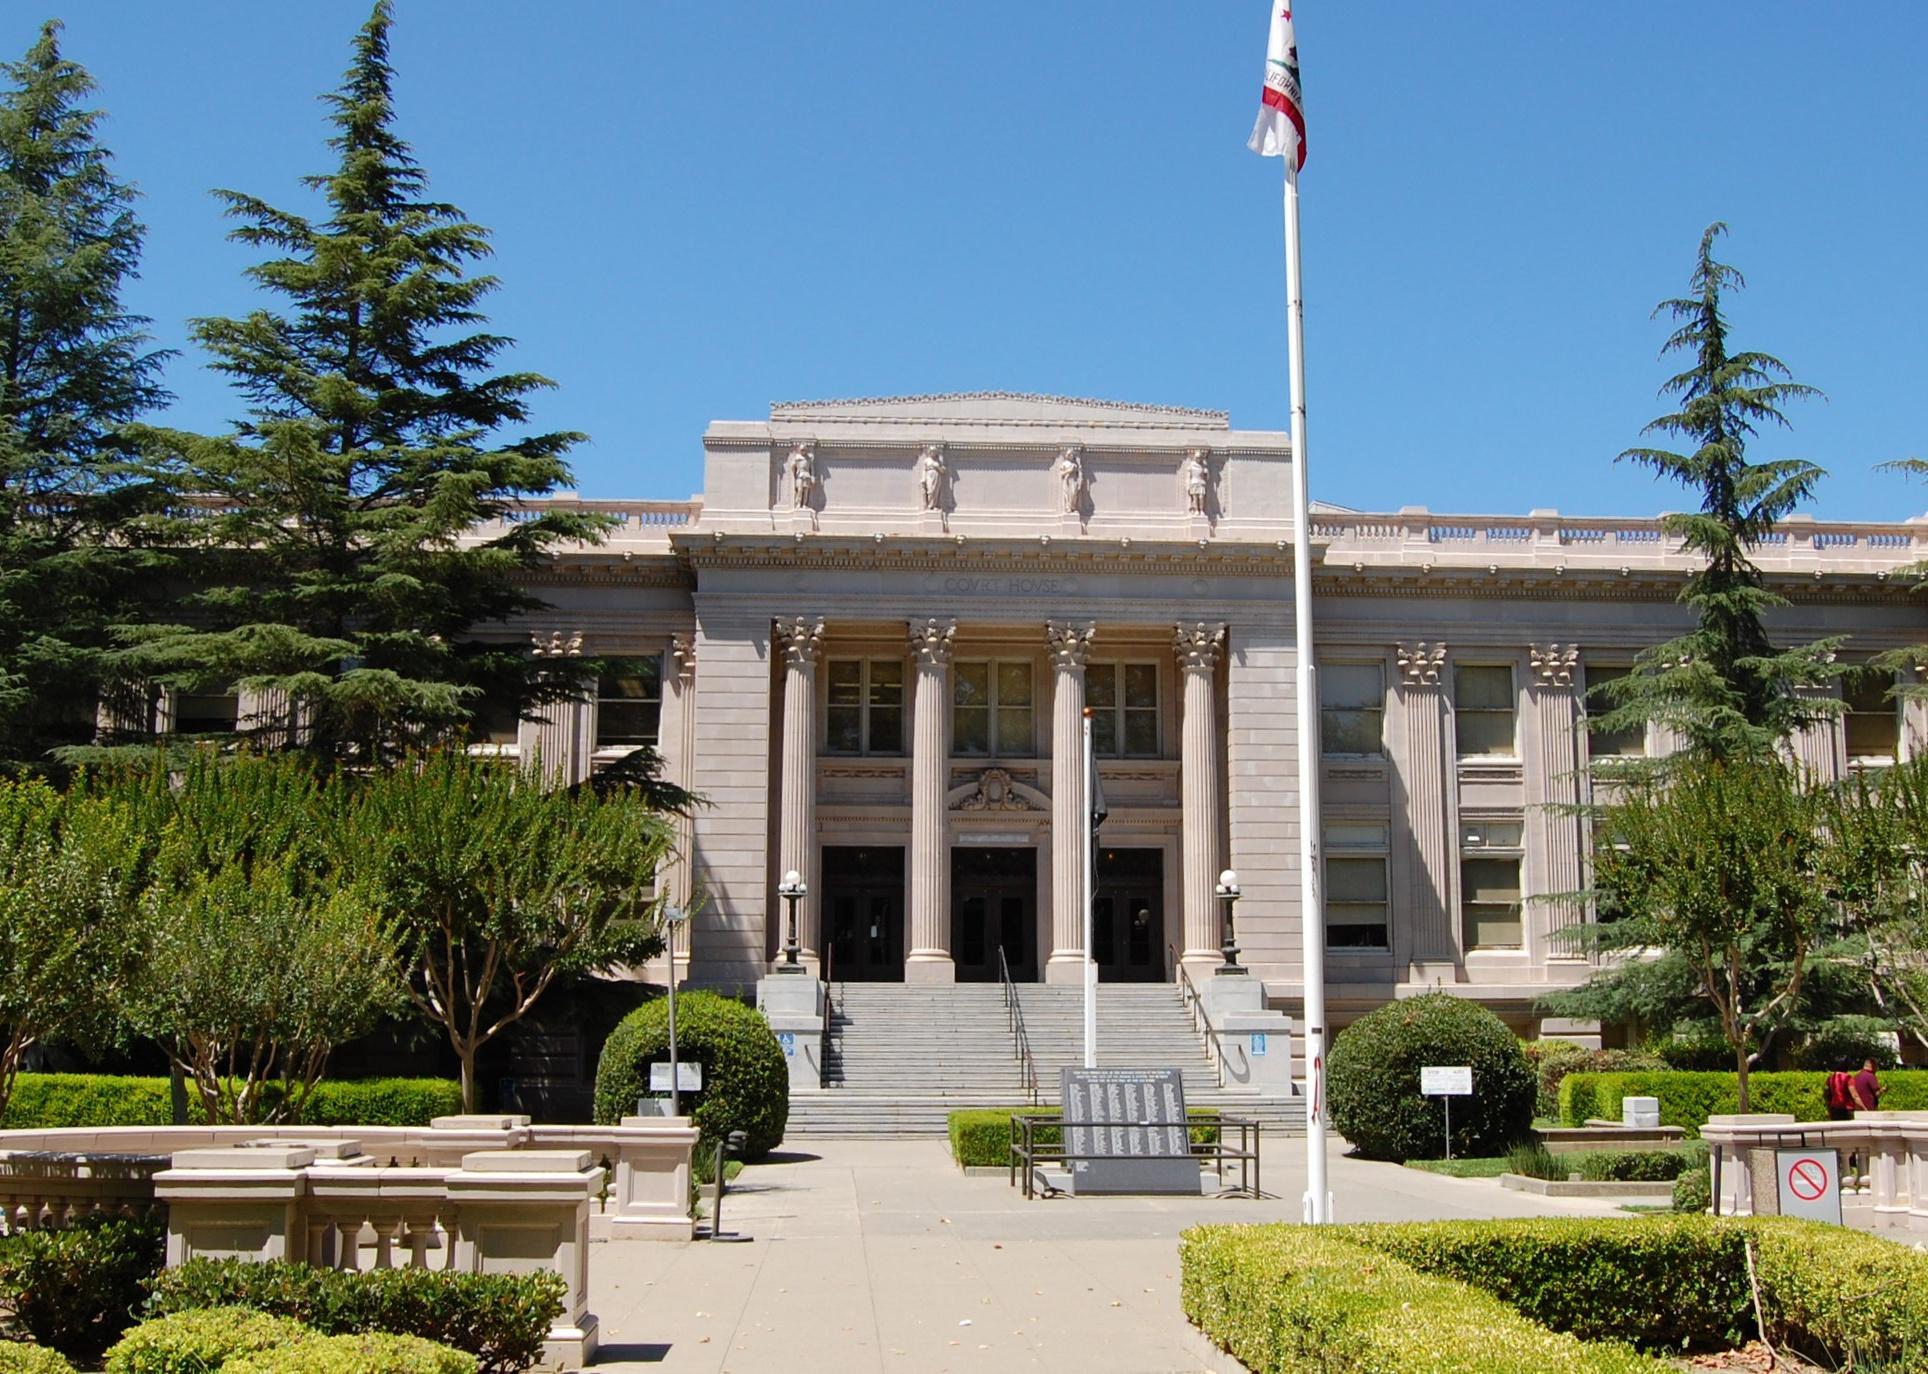
#27. San Luis Obispo County
– Emergency shelters per 100K people: 33.9 (96 shelters in database)
– Emergency shelter capacity per 100K: 7,032,242 people (19,885,141 total capacity)
– Shelters with generators: 15
– Shelters in 100-year floodplain: 0
Chmee2 // Wikimedia Commons
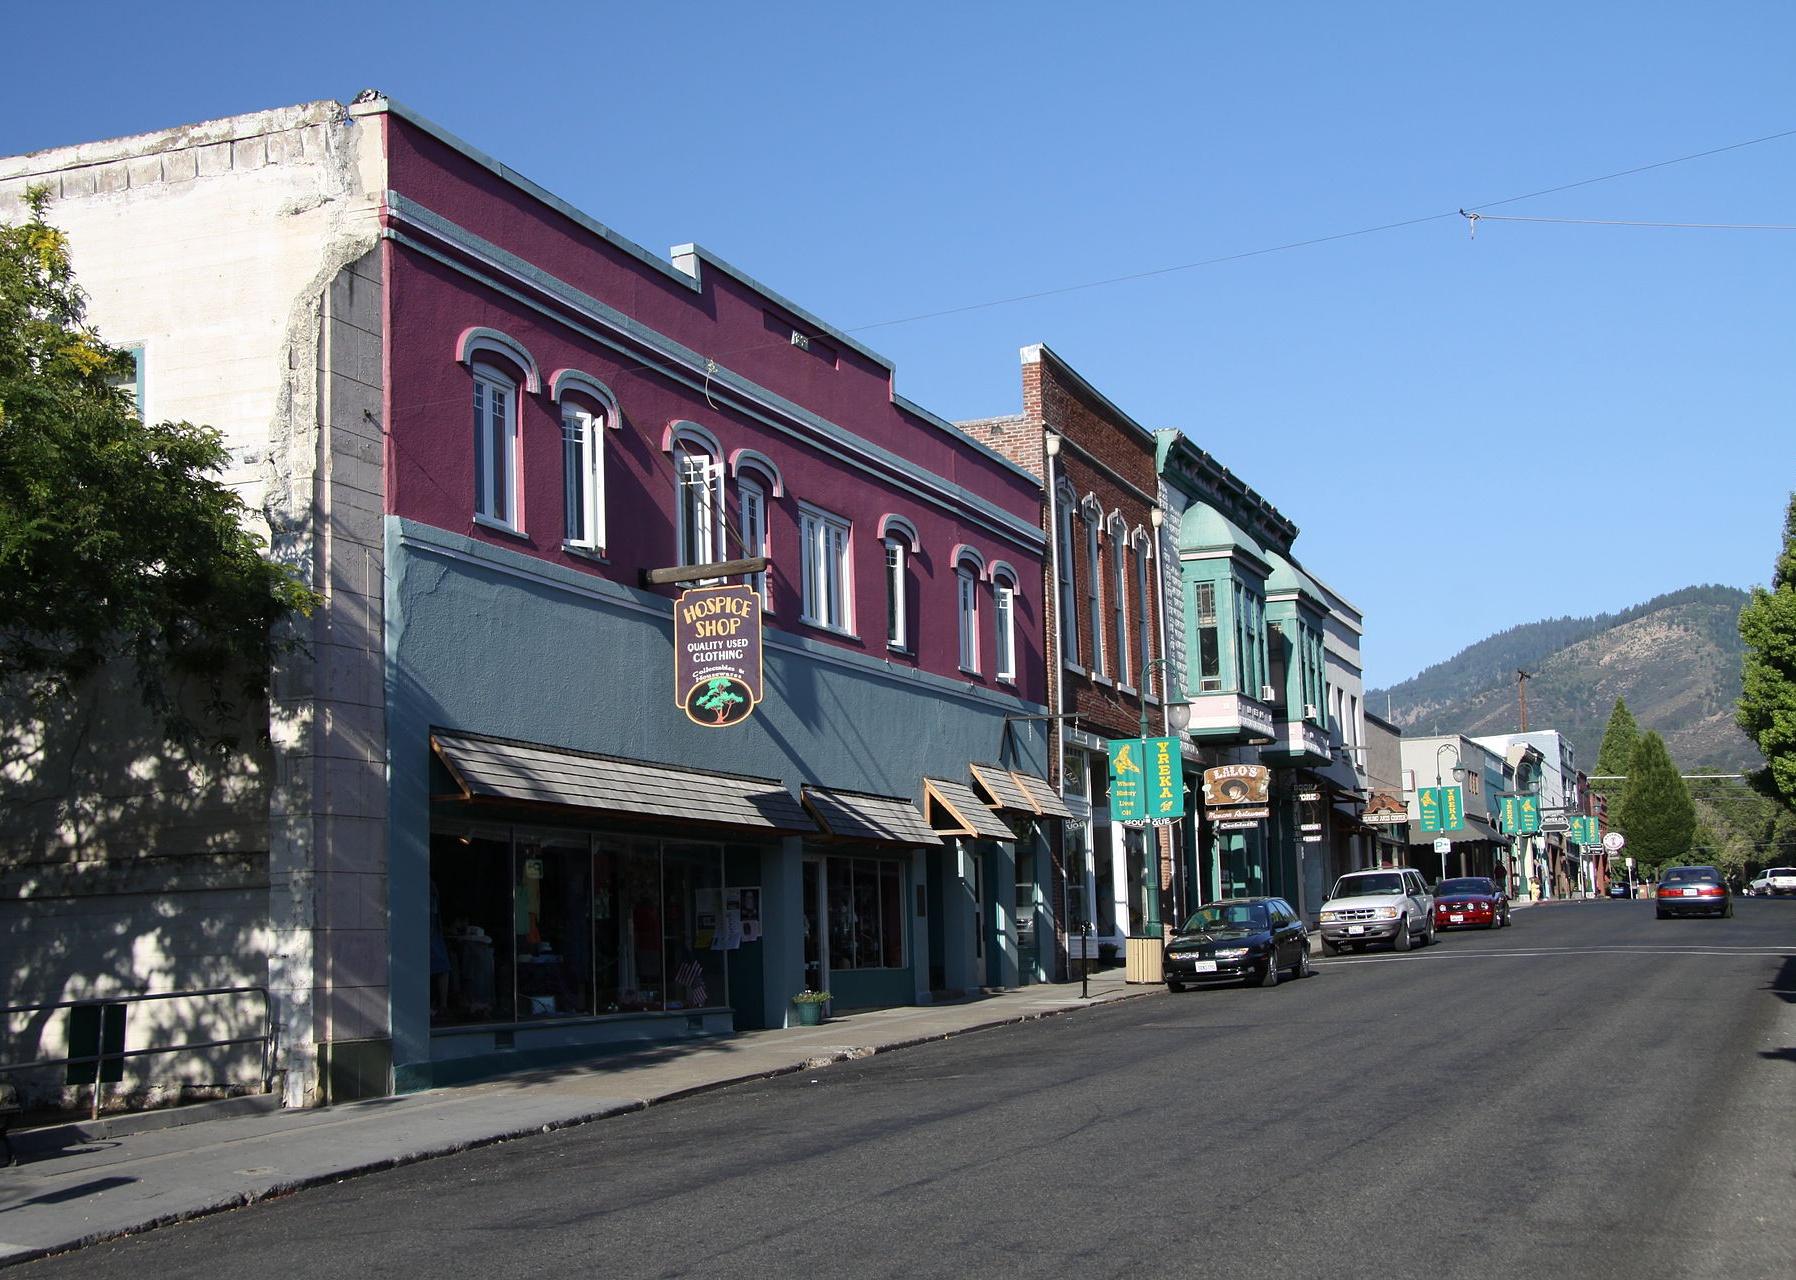
#26. Siskiyou County
– Emergency shelters per 100K people: 36.2 (16 shelters in database)
– Emergency shelter capacity per 100K: 12,518,579 people (5,527,078 total capacity)
– Shelters with generators: 0
– Shelters in 100-year floodplain: 0
Epolk // Wikimedia Commons
#25. Yolo County
– Emergency shelters per 100K people: 36.9 (80 shelters in database)
– Emergency shelter capacity per 100K: 9,480,172 people (20,543,818 total capacity)
– Shelters with generators: 2
– Shelters in 100-year floodplain: 15
Frank Schulenburg // Wikimedia Commons
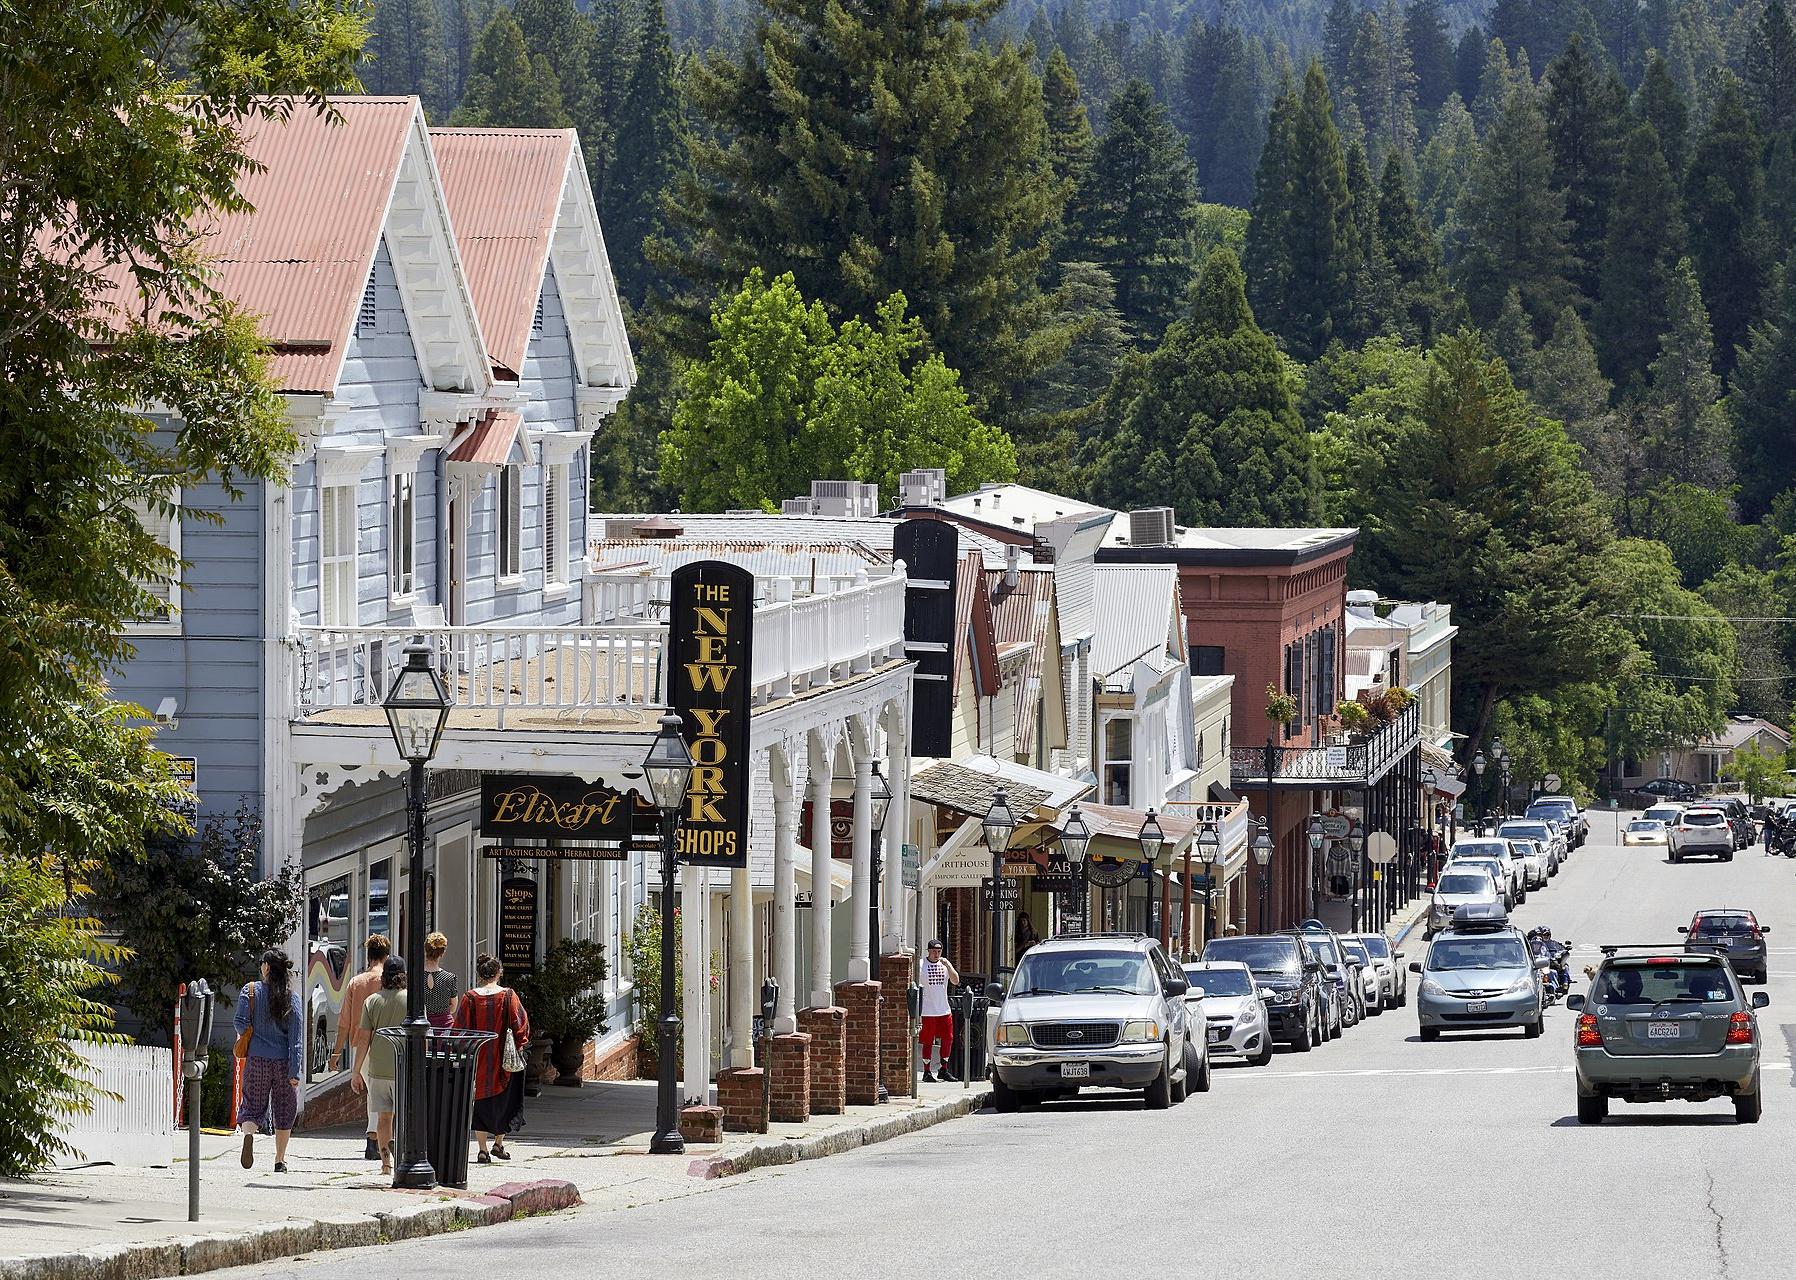
#24. Nevada County
– Emergency shelters per 100K people: 37.2 (38 shelters in database)
– Emergency shelter capacity per 100K: 8,650,053 people (8,830,839 total capacity)
– Shelters with generators: 2
– Shelters in 100-year floodplain: 0
Bobak Ha’Eri // Wikimedia Commons
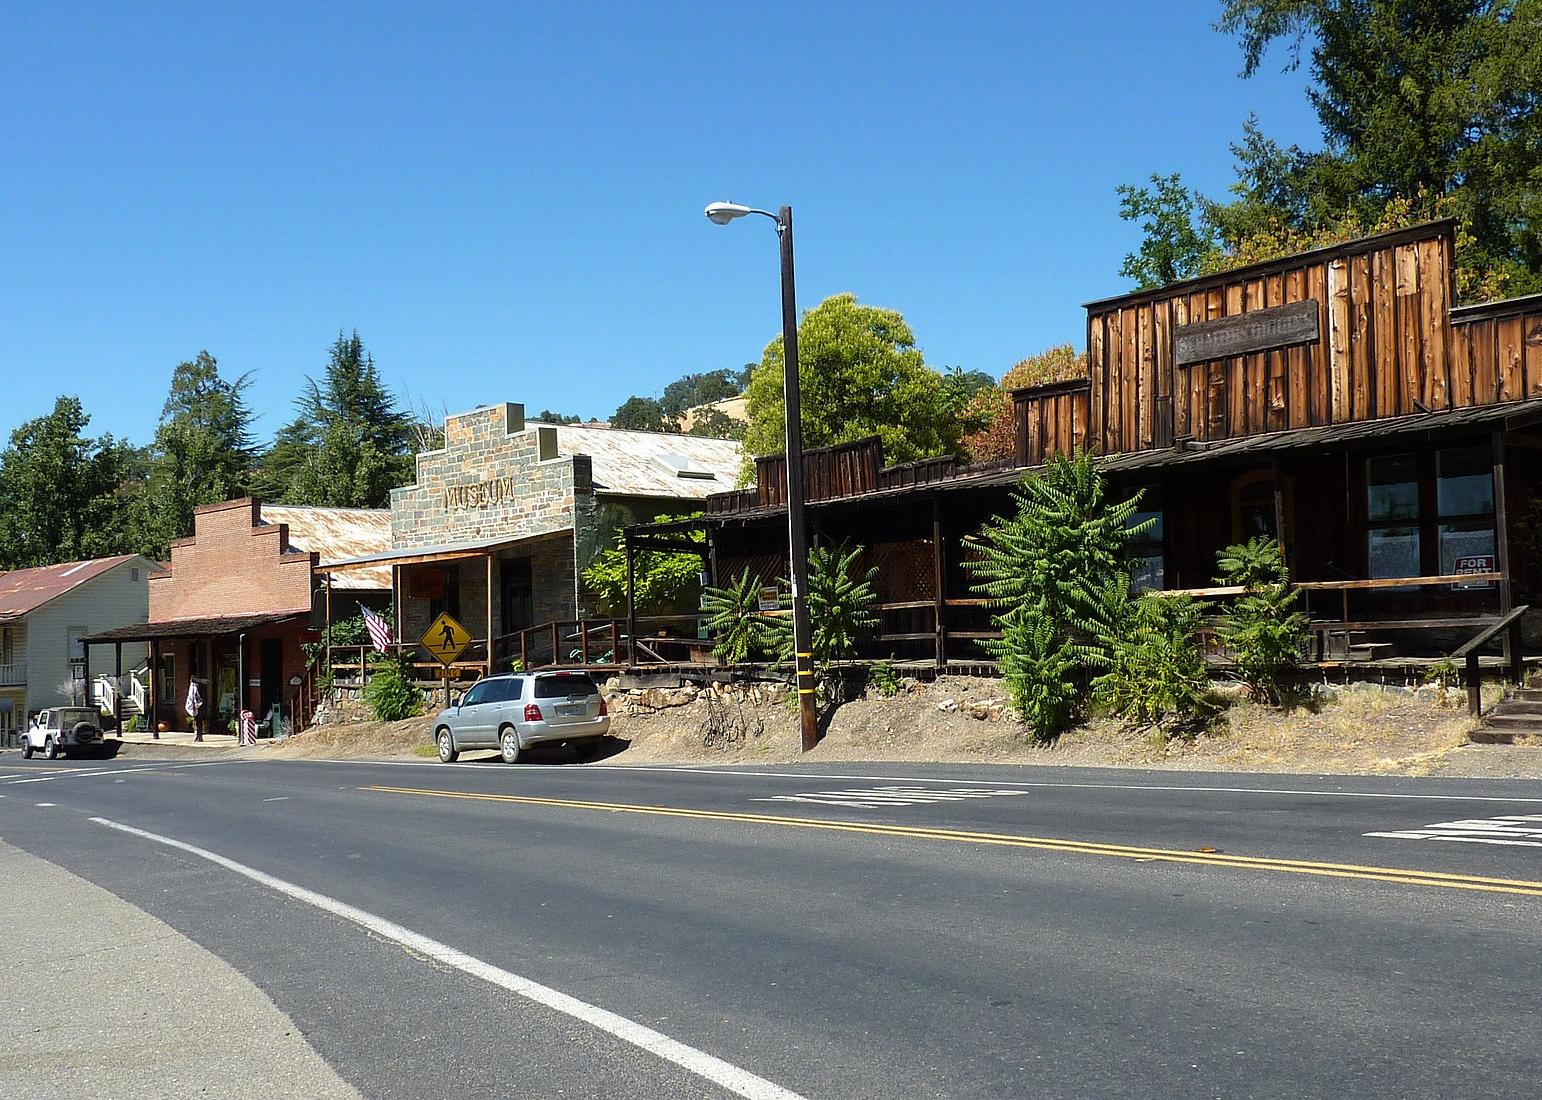
#23. Amador County
– Emergency shelters per 100K people: 37.4 (15 shelters in database)
– Emergency shelter capacity per 100K: 9,659,738 people (3,873,072 total capacity)
– Shelters with generators: 0
– Shelters in 100-year floodplain: 0
Aaronbrick // Wikicommons
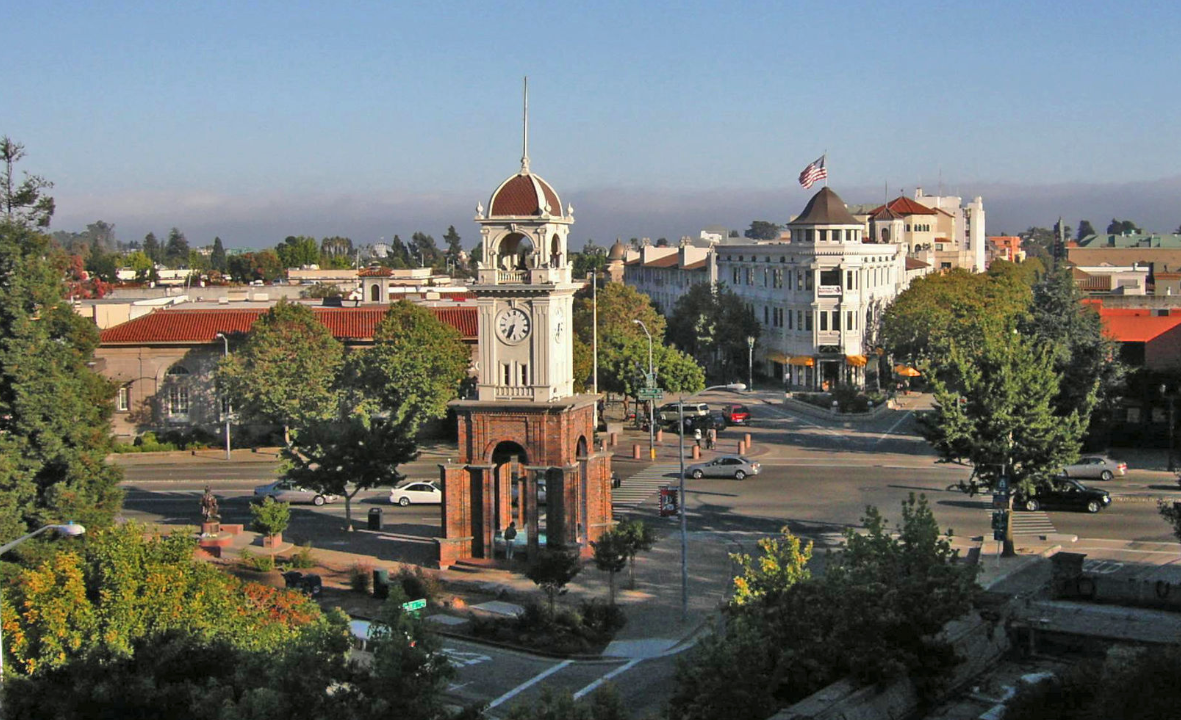
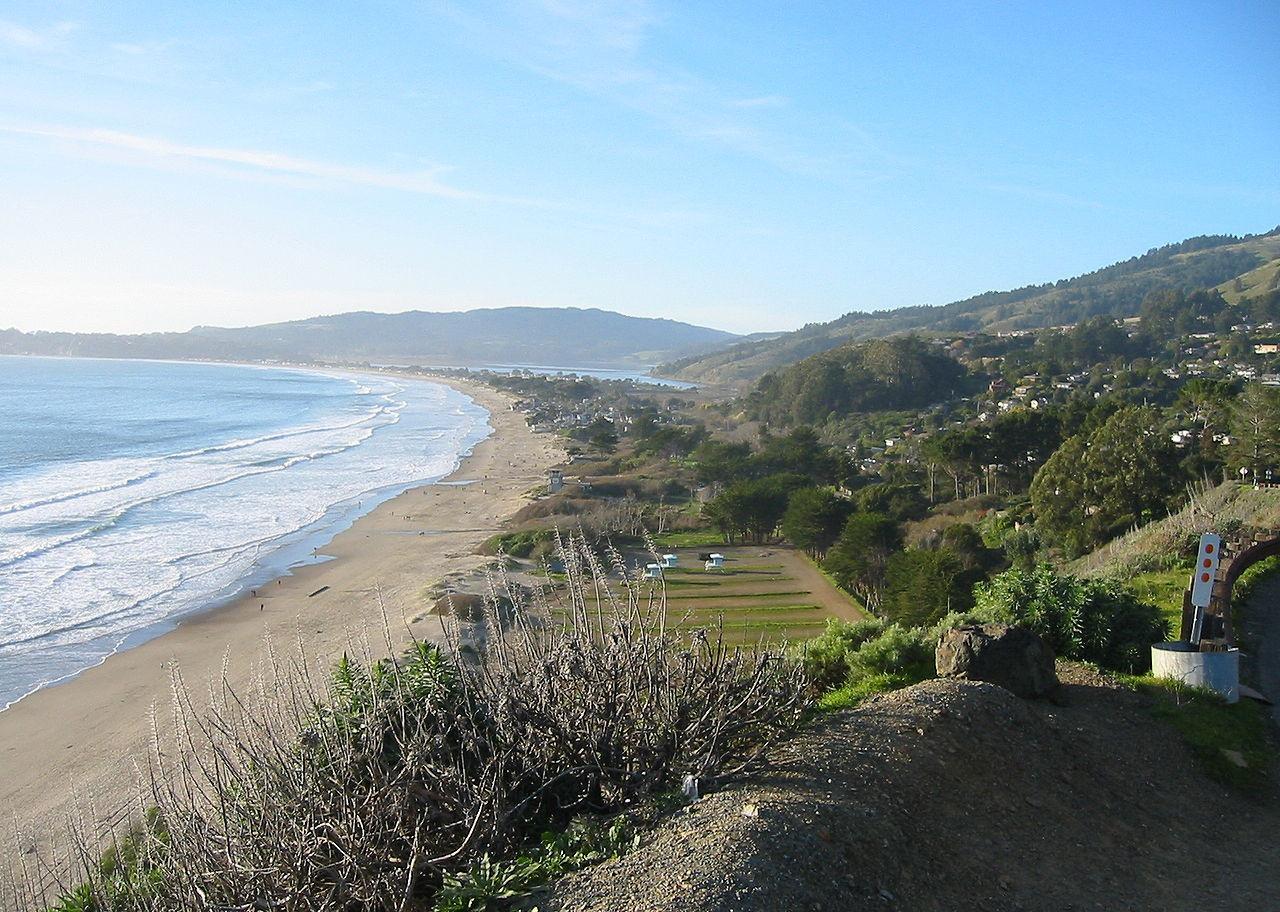
#22. Santa Cruz County
– Emergency shelters per 100K people: 39.3 (107 shelters in database)
– Emergency shelter capacity per 100K: 9,274,989 people (25,240,770 total capacity)
– Shelters with generators: 6
– Shelters in 100-year floodplain: 3
Fred Hsu // Wikicommons
#21. Sonoma County
– Emergency shelters per 100K people: 39.6 (195 shelters in database)
– Emergency shelter capacity per 100K: 9,433,525 people (46,459,920 total capacity)
– Shelters with generators: 16
– Shelters in 100-year floodplain: 1
Pixabay
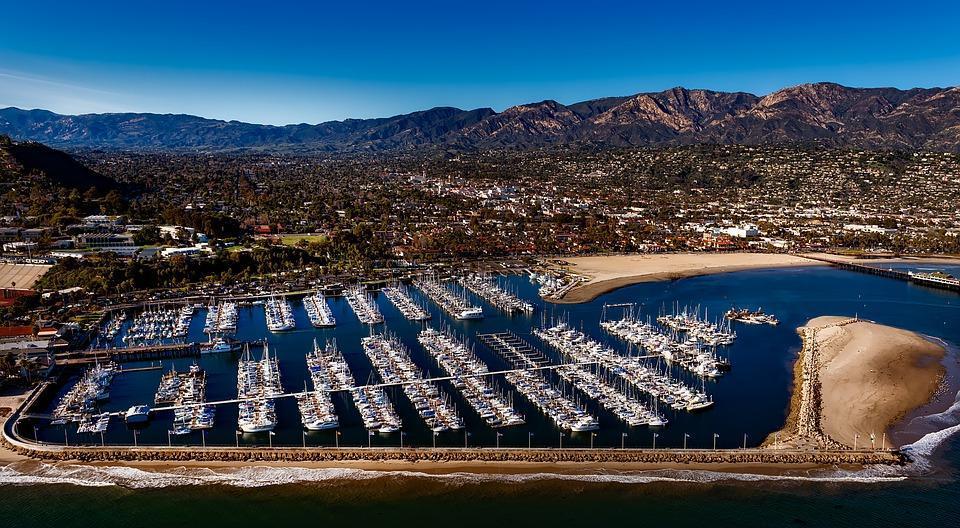
#20. Santa Barbara County
– Emergency shelters per 100K people: 41.1 (184 shelters in database)
– Emergency shelter capacity per 100K: 9,188,214 people (41,131,134 total capacity)
– Shelters with generators: 6
– Shelters in 100-year floodplain: 0

Rman 348 // Wikimedia Commons
#19. Imperial County
– Emergency shelters per 100K people: 44.4 (80 shelters in database)
– Emergency shelter capacity per 100K: 9,371,919 people (16,874,233 total capacity)
– Shelters with generators: 3
– Shelters in 100-year floodplain: 0
Canva
#18. Butte County
– Emergency shelters per 100K people: 49.1 (107 shelters in database)
– Emergency shelter capacity per 100K: 11,243,281 people (24,497,311 total capacity)
– Shelters with generators: 5
– Shelters in 100-year floodplain: 1
Ray Bouknight // Wikicommons
#17. Sutter County
– Emergency shelters per 100K people: 50.5 (50 shelters in database)
– Emergency shelter capacity per 100K: 9,958,545 people (9,866,926 total capacity)
– Shelters with generators: 1
– Shelters in 100-year floodplain: 1
Canva
#16. Calaveras County
– Emergency shelters per 100K people: 52.9 (24 shelters in database)
– Emergency shelter capacity per 100K: 18,316,907 people (8,306,534 total capacity)
– Shelters with generators: 0
– Shelters in 100-year floodplain: 0
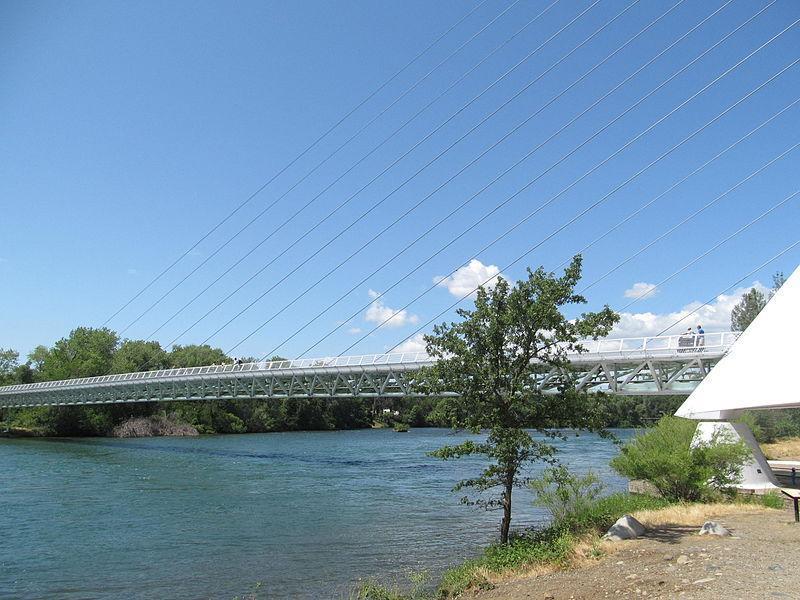
Doug Kerr // Wikicommons
#15. Shasta County
– Emergency shelters per 100K people: 58.8 (107 shelters in database)
– Emergency shelter capacity per 100K: 13,191,059 people (23,999,154 total capacity)
– Shelters with generators: 1
– Shelters in 100-year floodplain: 0
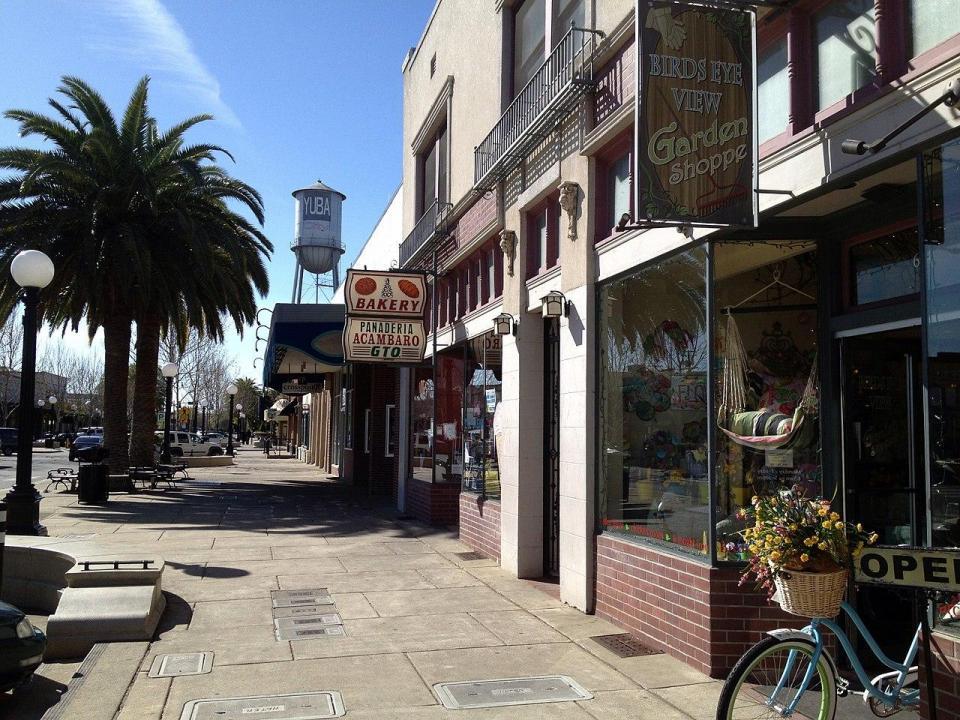
U.S. Army Corps of Engineers Sacramento District // Wikimedia Commons
#14. Yuba County
– Emergency shelters per 100K people: 59.7 (48 shelters in database)
– Emergency shelter capacity per 100K: 12,534,488 people (10,078,230 total capacity)
– Shelters with generators: 0
– Shelters in 100-year floodplain: 0
Kglavin // Wikimedia Commons
#13. Marin County
– Emergency shelters per 100K people: 62.9 (165 shelters in database)
– Emergency shelter capacity per 100K: 13,454,878 people (35,303,850 total capacity)
– Shelters with generators: 7
– Shelters in 100-year floodplain: 3
Binksternet // Wikimedia Commons
#12. Mendocino County
– Emergency shelters per 100K people: 63.4 (58 shelters in database)
– Emergency shelter capacity per 100K: 12,883,842 people (11,793,096 total capacity)
– Shelters with generators: 1
– Shelters in 100-year floodplain: 0
Cory Maylett // Wikimedia Commons
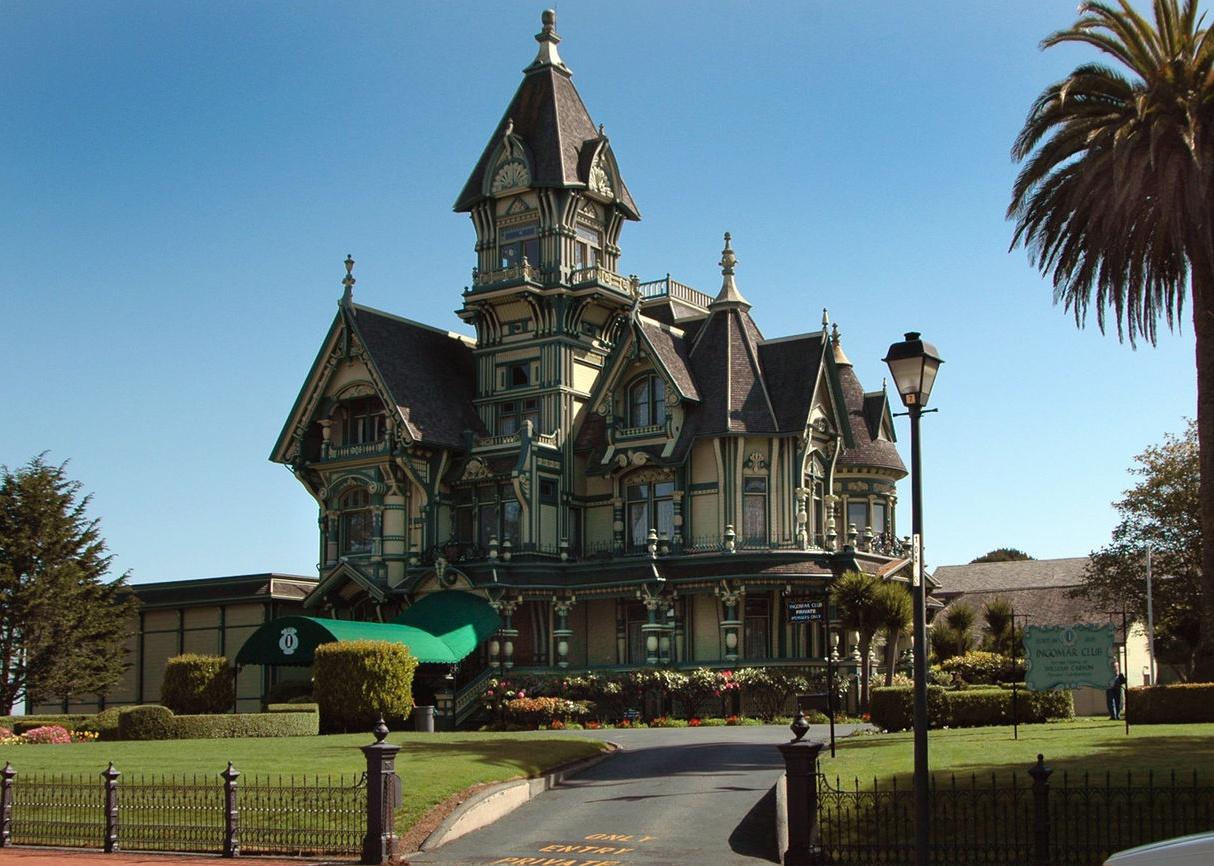
#11. Humboldt County
– Emergency shelters per 100K people: 65.7 (90 shelters in database)
– Emergency shelter capacity per 100K: 22,551,543 people (30,898,771 total capacity)
– Shelters with generators: 3
– Shelters in 100-year floodplain: 0

Canva
#10. Del Norte County
– Emergency shelters per 100K people: 72.3 (20 shelters in database)
– Emergency shelter capacity per 100K: 15,727,474 people (4,349,433 total capacity)
– Shelters with generators: 2
– Shelters in 100-year floodplain: 3
![]()
CFang // Wikimedia Commons
#9. Lake County
– Emergency shelters per 100K people: 82.7 (56 shelters in database)
– Emergency shelter capacity per 100K: 28,431,463 people (19,262,032 total capacity)
– Shelters with generators: 2
– Shelters in 100-year floodplain: 0
Chuck Abbe // Wikimedia Commons
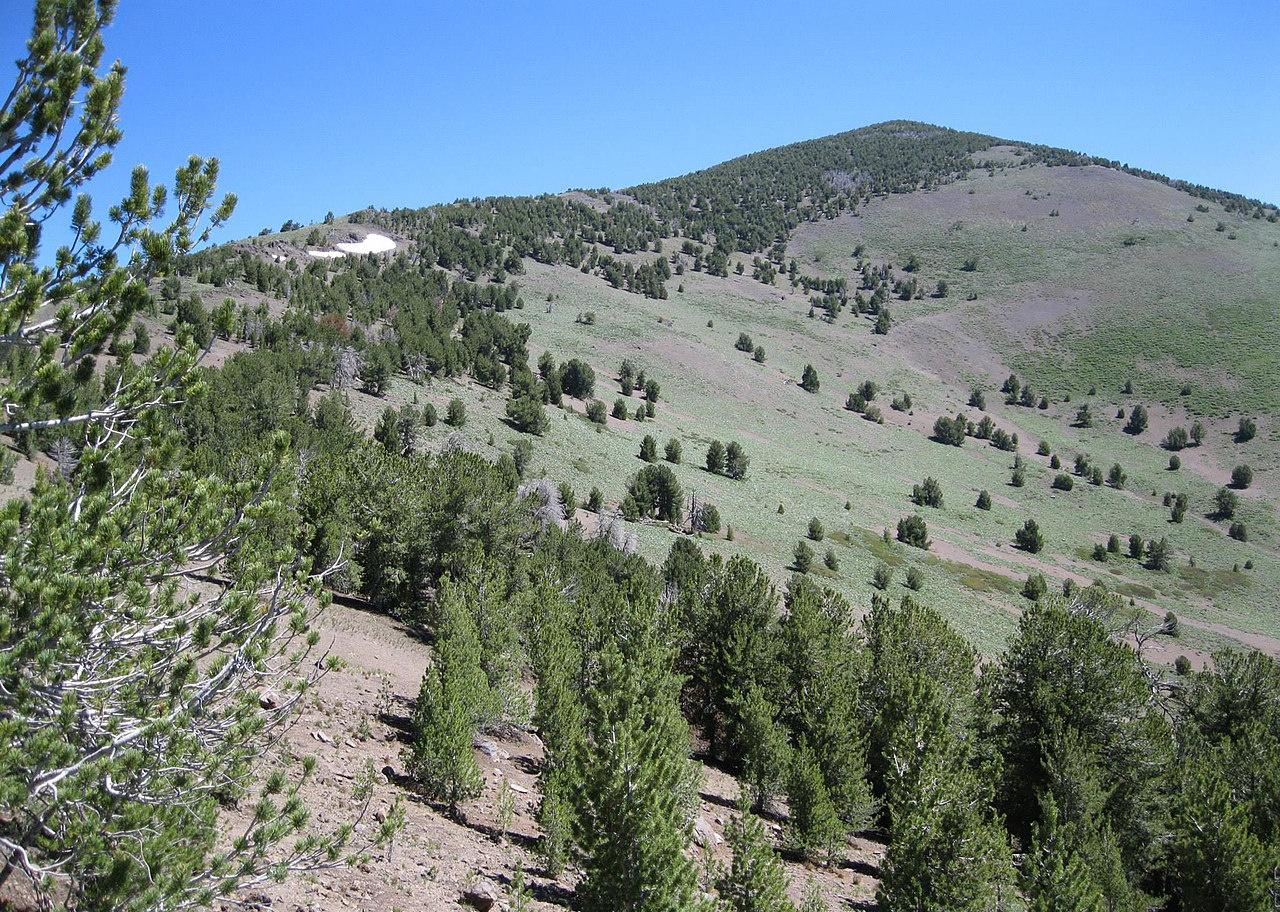
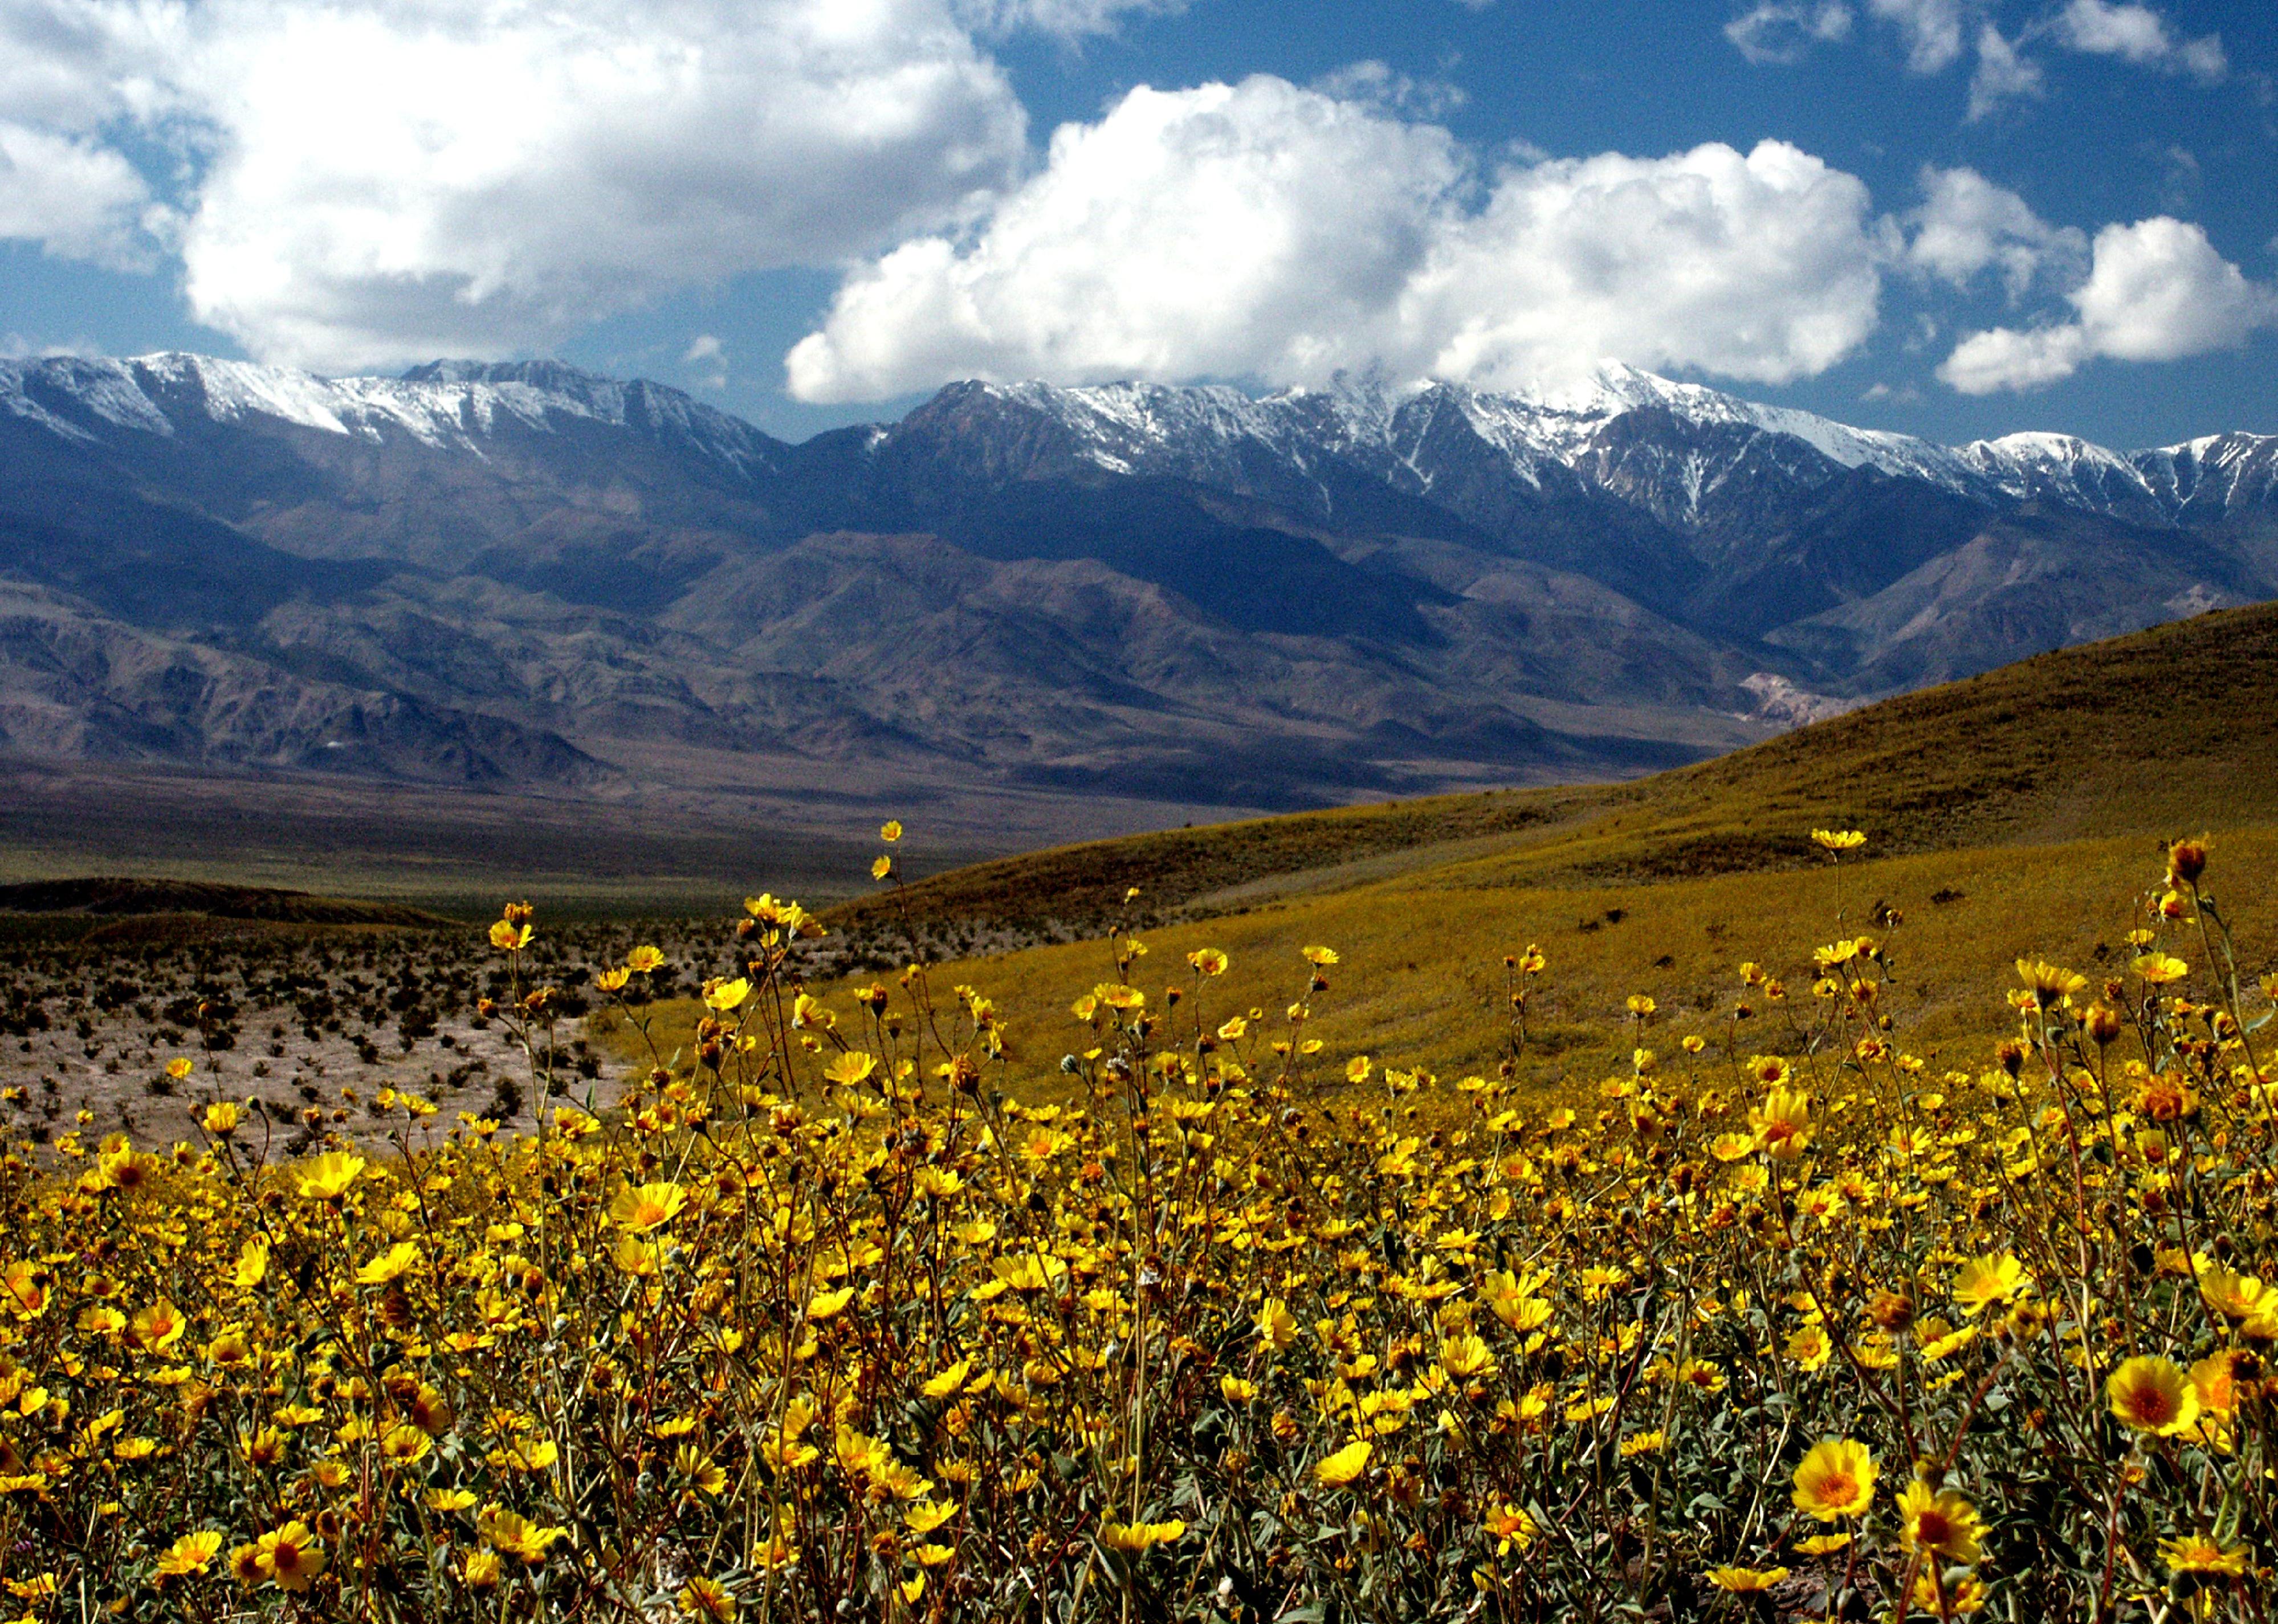
#8. Inyo County
– Emergency shelters per 100K people: 90.4 (17 shelters in database)
– Emergency shelter capacity per 100K: 25,167,576 people (4,732,511 total capacity)
– Shelters with generators: 2
– Shelters in 100-year floodplain: 0
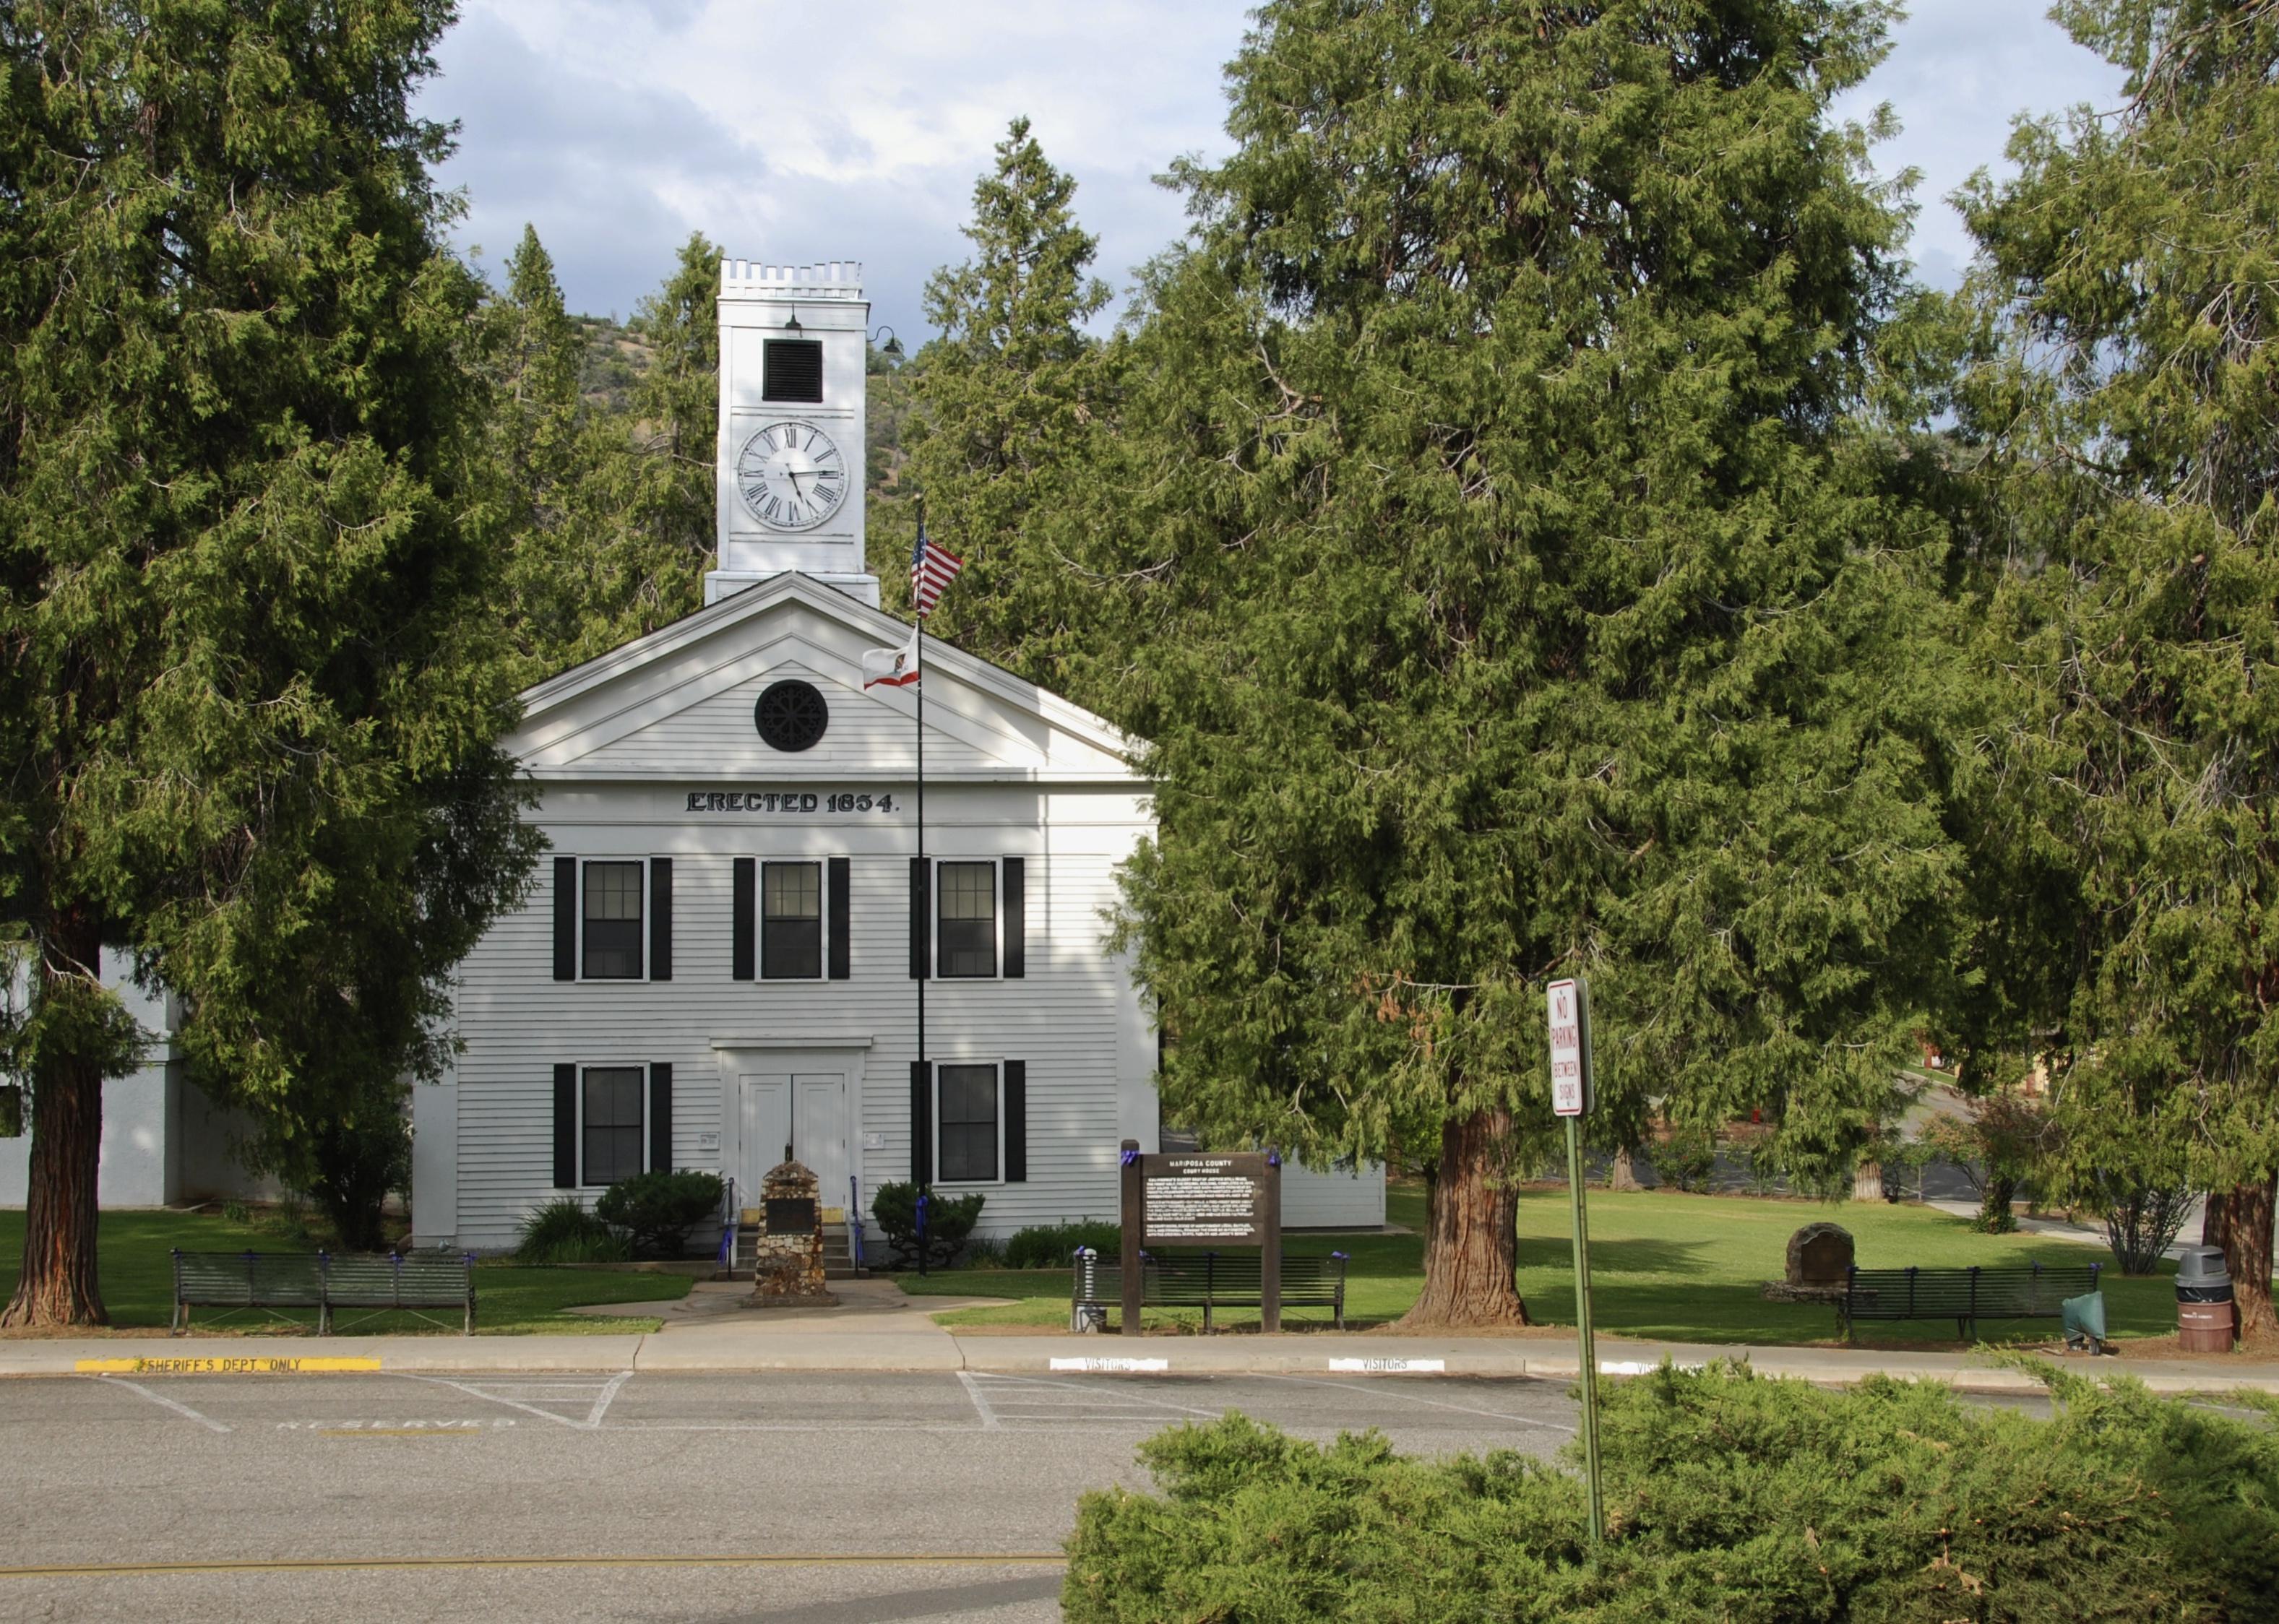
EPoelzl // Wikimedia Commons
#7. Mariposa County
– Emergency shelters per 100K people: 92.9 (16 shelters in database)
– Emergency shelter capacity per 100K: 31,892,099 people (5,493,414 total capacity)
– Shelters with generators: 0
– Shelters in 100-year floodplain: 0
Trance addict // Wikimedia Commons
#6. Glenn County
– Emergency shelters per 100K people: 94.2 (27 shelters in database)
– Emergency shelter capacity per 100K: 17,551,201 people (5,032,807 total capacity)
– Shelters with generators: 0
– Shelters in 100-year floodplain: 0
Almonroth // Wikimedia Commons
#5. Trinity County
– Emergency shelters per 100K people: 113.8 (18 shelters in database)
– Emergency shelter capacity per 100K: 36,841,440 people (5,827,579 total capacity)
– Shelters with generators: 1
– Shelters in 100-year floodplain: 0
CleanWater17 // Wikimedia Commons
#4. Colusa County
– Emergency shelters per 100K people: 114.8 (25 shelters in database)
– Emergency shelter capacity per 100K: 27,015,358 people (5,883,945 total capacity)
– Shelters with generators: 2
– Shelters in 100-year floodplain: 0
Kenneth Green // Wikimedia Commons
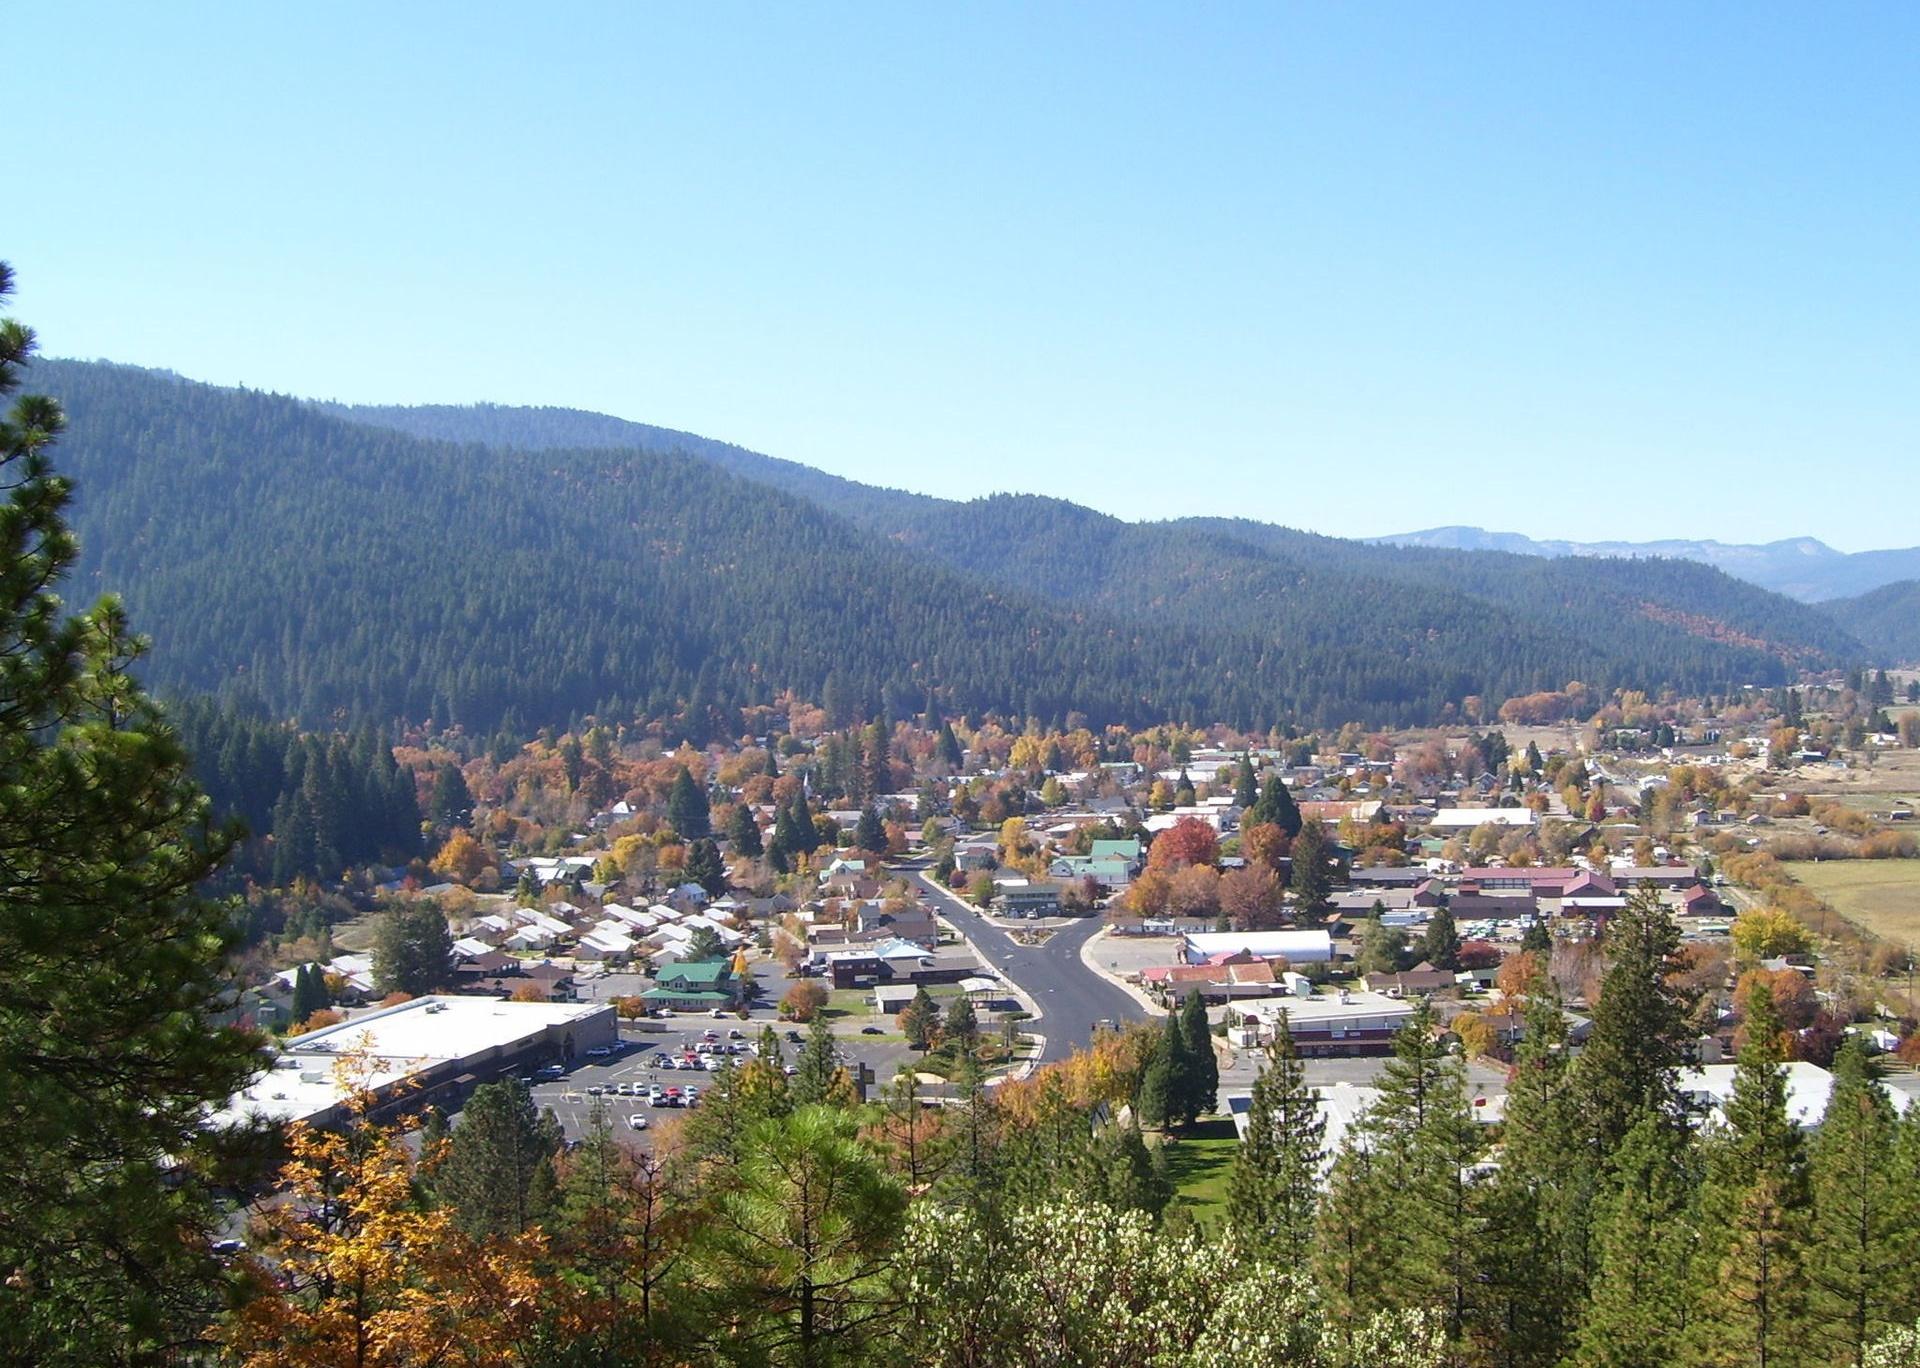
#3. Plumas County
– Emergency shelters per 100K people: 127.3 (25 shelters in database)
– Emergency shelter capacity per 100K: 33,089,797 people (6,495,858 total capacity)
– Shelters with generators: 1
– Shelters in 100-year floodplain: 0
clr_flickr from Rocklin, USA // Wikimedia Commons
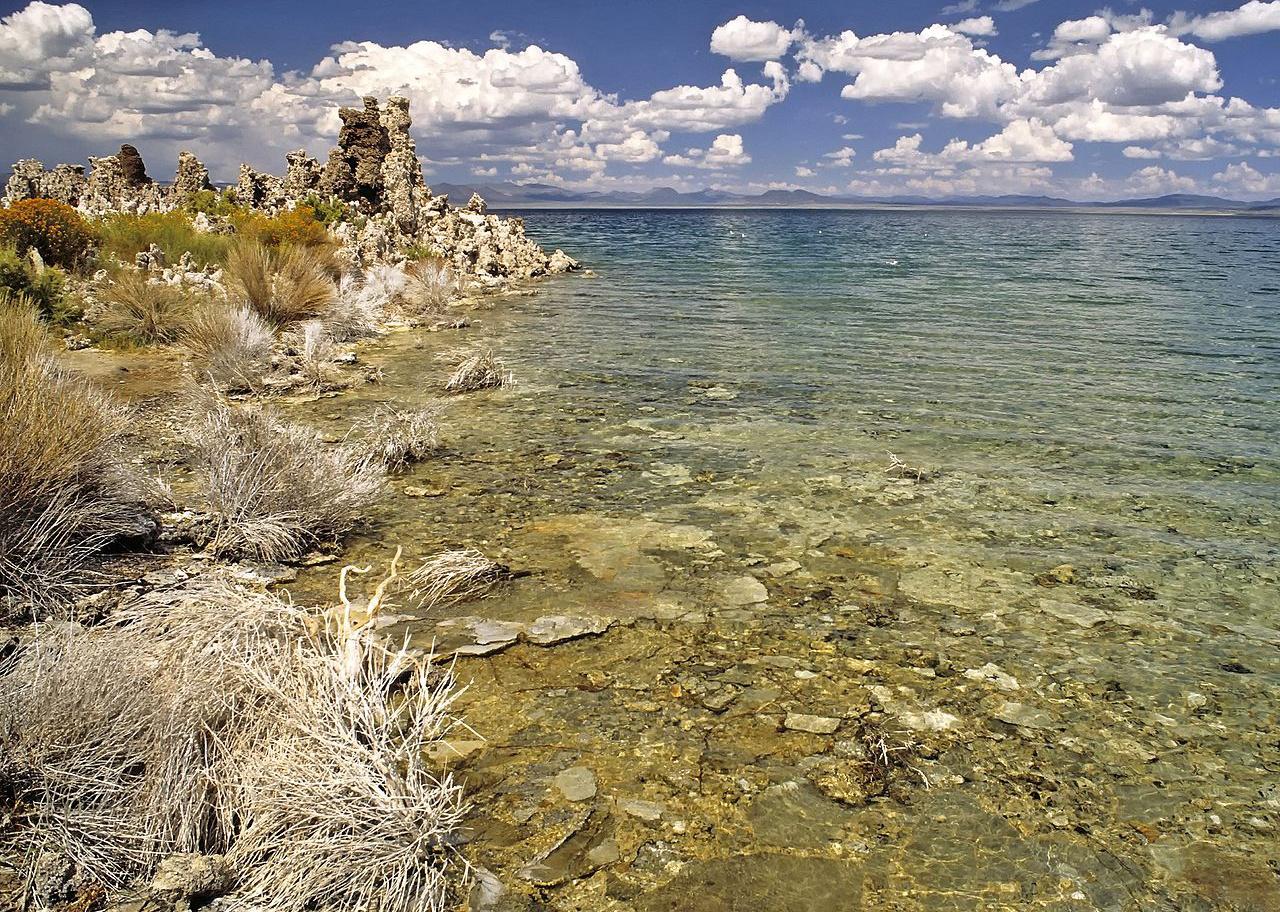
#2. Mono County
– Emergency shelters per 100K people: 165.5 (22 shelters in database)
– Emergency shelter capacity per 100K: 31,146,565 people (4,139,690 total capacity)
– Shelters with generators: 5
– Shelters in 100-year floodplain: 1
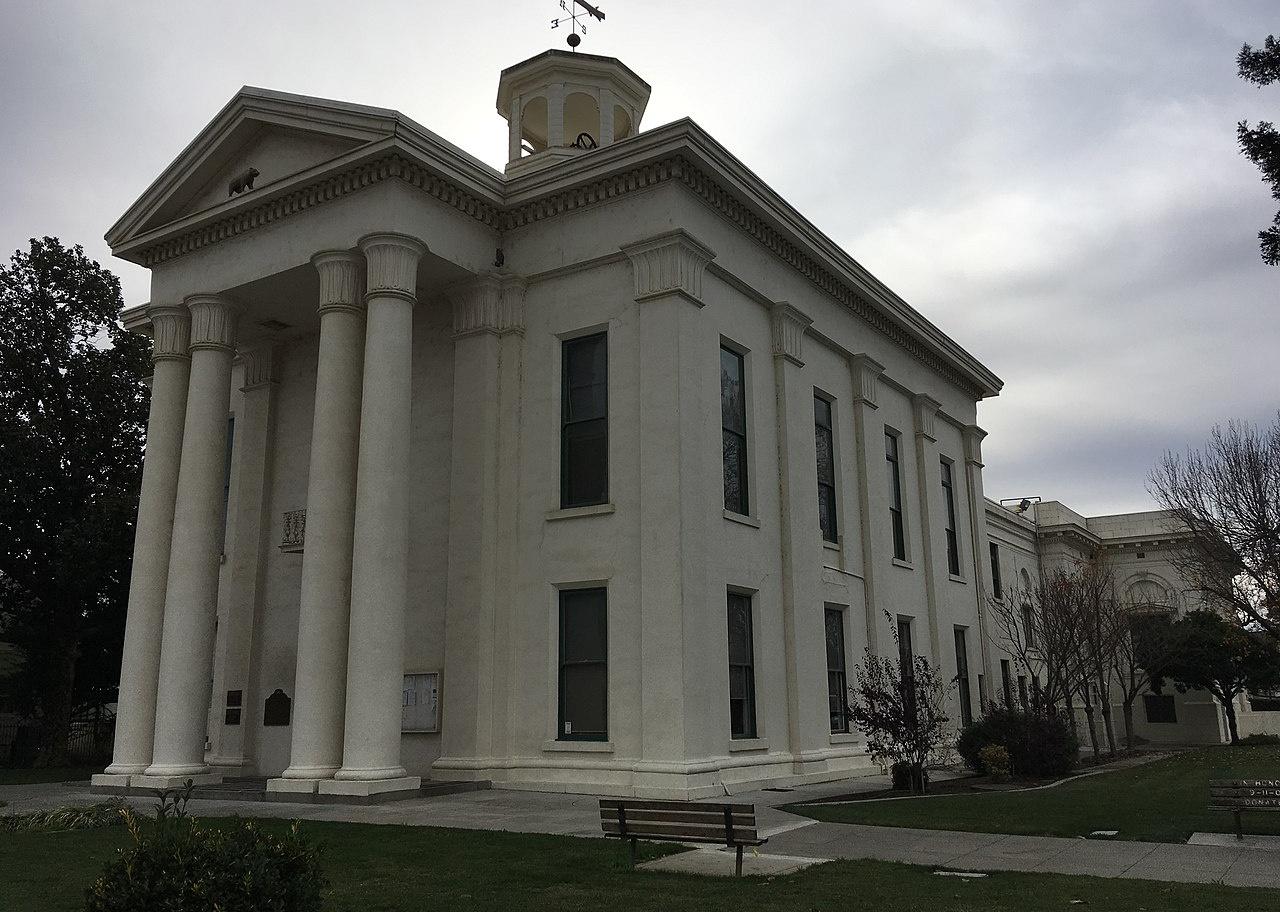
Susan Popielaski // Wikimedia Commons
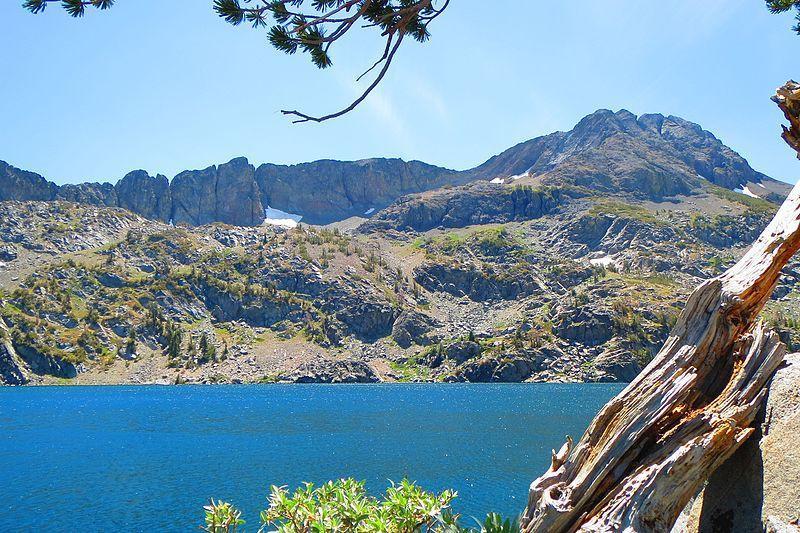
#1. Alpine County
– Emergency shelters per 100K people: 223.2 (3 shelters in database)
– Emergency shelter capacity per 100K: 74,201,339 people (997,266 total capacity)
– Shelters with generators: 1
– Shelters in 100-year floodplain: 0