
States that have increased taxes the most in the last four decades

chayanuphol // Shutterstock
States that have increased taxes the most in the last four decades
A person filling out an income tax form.
Depending on where you live in the U.S., your state and local taxes may have shifted over the last year.
The feared decline in American spending at the onset of the COVID-19 pandemic never fully materialized as stimulus and pandemic aid programs kept consumers buying and sending sales taxes into state and local government coffers.
But while the stimulus-fueled spending spree alleviated concerns about bringing in tax revenue for critical functions in local government, it also helped spur record inflation. Some states are adjusting taxes in response: Utah, for example, moved to reduce individual and corporate income tax rates for 2022.
Stacker examined data from the nonprofit Tax Foundation to see which states have recorded the biggest tax growth in the last four decades. States were ranked by the percentage-point change of each state’s effective tax rate from 1980 to 2022. Ties were broken by the growth from 2021. The overall per capita burden was used if those numbers were the same.
Effective tax rates were calculated by dividing the state and local taxes residents pay by the state’s share of the gross national product. Those taxes include property, sales, income, and other taxes recorded by the Census Bureau’s State and Local Government Finance division.
In 2022, the national average state-local tax burden is 11.2%, unchanged from the year before. “Tax burden” is a term used to describe the effective amount of taxes each person in a state pays its government. “State-local” refers to a combination of state and local tax rates, excluding federal taxes. It can account for income and the portion of corporate taxes shifted to consumers via increased costs or lower wages.
Twenty-one states—including Oregon, Colorado, Alaska, Maryland, and Georgia—have lowered effective state-local tax rates since 1980. In Alaska, taxes on oil extraction have ensured a large portion of state taxes are footed by the business activities of nonresidents. Residents of the other 30 states have seen tax rates increase as much as three percentage points in that timeframe.
States with the largest tax growth have high effective tax rates overall, largely due to high state spending and tax payments to out-of-state governments. In Connecticut, for example, residents pay taxes to neighboring New York, while states with large tourism industries like Vermont and Hawaii export tax burdens to the rest of the U.S.
Only one state has seen tax rates rise more in the last four decades than the residents of the lush Hawaiian islands with its high cost of living and people paying a 14% effective tax rate (about $8,400 in taxes per person annually). Continue reading to see which it is.
You may also like: Cost of gold the year you were born
![]()

Marc Cappelletti // Shutterstock
#51. Alaska
Boats and buildings in Sitka, Alaska.
– Change from 1980: -4.3 percentage points
– Change from 2021: +0.5 percentage points
– State-local effective tax rate 2022: 4.6%
– State-local tax burden per capita: $2,943

Gary R Ennis Photos // Shutterstock
#50. Michigan
Downtown Traverse City, Michigan.
– Change from 1980: -2.0 percentage points
– Change from 2021: -0.4 percentage points
– State-local effective tax rate 2022: 8.6%
– State-local tax burden per capita: $4,720

Canva
#49. North Dakota
Fargo, North Dakota.
– Change from 1980: -2.0 percentage points
– Change from 2021: +0.9 percentage points
– State-local effective tax rate 2022: 8.8%
– State-local tax burden per capita: $5,403

Sean Pavone // Shutterstock
#48. District of Columbia
The Washington Monument and Reflecting Pool in Washington D.C.
– Change from 1980: -1.8 percentage points
– Change from 2021: +0.3 percentage points
– State-local effective tax rate 2022: 12.0%
– State-local tax burden per capita: $11,654

Canva
#47. Wisconsin
Madison, Wisconsin.
– Change from 1980: -1.3 percentage points
– Change from 2021: -0.4 percentage points
– State-local effective tax rate 2022: 10.9%
– State-local tax burden per capita: $6,231

ESB Professional // Shutterstock
#46. Georgia
A view of Atlanta’s skyline from Lake Meer in Piedmont Park.
– Change from 1980: -1.0 percentage points
– Change from 2021: -0.2 percentage points
– State-local effective tax rate 2022: 8.9%
– State-local tax burden per capita: $4,862

PQK // Shutterstock
#45. South Carolina
The scenic river view and waterfront houses in North Myrtle Beach, South Carolina.
– Change from 1980: -0.8 percentage points
– Change from 2021: -0.5 percentage points
– State-local effective tax rate 2022: 8.9%
– State-local tax burden per capita: $4,596

Brandon Burris // Shutterstock
#44. Arizona
Downtown Phoenix.
– Change from 1980: -0.7 percentage points
– Change from 2021: -0.1 percentage points
– State-local effective tax rate 2022: 9.5%
– State-local tax burden per capita: $5,156

quiggyt4 // Shutterstock
#43. Massachusetts
The historic street clock in Wellesley, Massachusetts.
– Change from 1980: -0.6 percentage points
– Change from 2021: +0.1 percentage points
– State-local effective tax rate 2022: 11.5%
– State-local tax burden per capita: $9,405

Hank Shiffman // Shutterstock
#42. South Dakota
The western suburbs of Rapid City, South Dakota.
– Change from 1980: -0.5 percentage points
– Change from 2021: -0.3 percentage points
– State-local effective tax rate 2022: 8.4%
– State-local tax burden per capita: $5,196

Canva
#41. Wyoming
Casper, Wyoming.
– Change from 1980: -0.4 percentage points
– Change from 2021: -0.8 percentage points
– State-local effective tax rate 2022: 7.5%
– State-local tax burden per capita: $4,691

Canva
#40. West Virginia
Charleston, West Virginia, at sunset.
– Change from 1980: -0.4 percentage points
– Change from 2021: -0.3 percentage points
– State-local effective tax rate 2022: 9.8%
– State-local tax burden per capita: $4,479
Jess Kraft // Shutterstock
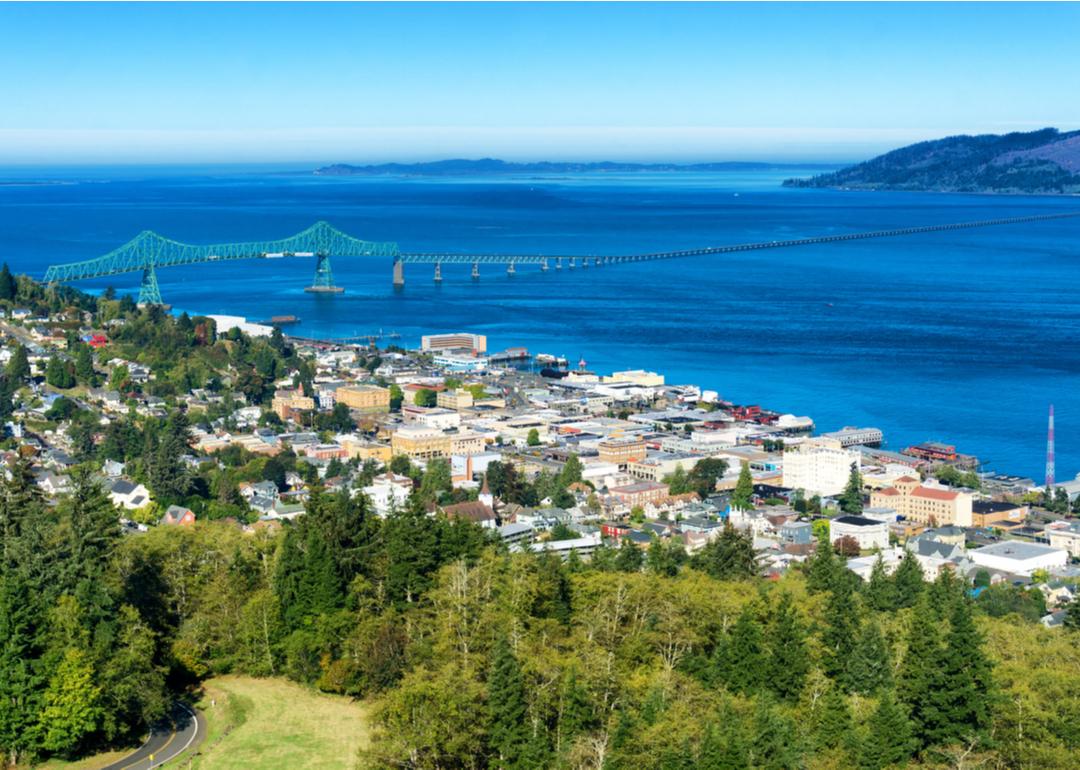
#39. Oregon
Astoria, Oregon, overlooking the Astoria Megler Bridge as it crosses the Columbia River.
– Change from 1980: -0.4 percentage points
– Change from 2021: -0.3 percentage points
– State-local effective tax rate 2022: 10.8%
– State-local tax burden per capita: $6,572

Nolichuckyjake // Shutterstock
#38. Tennessee
Johnson City, Tennessee.
– Change from 1980: -0.4 percentage points
– Change from 2021: -0.1 percentage points
– State-local effective tax rate 2022: 7.6%
– State-local tax burden per capita: $4,036

eurobanks // Shutterstock
#37. Maryland
Pedestrians strolling on a boardwalk in Ocean City, Maryland.
– Change from 1980: -0.3 percentage points
– Change from 2021: -0.6 percentage points
– State-local effective tax rate 2022: 11.3%
– State-local tax burden per capita: $7,680

Lauren Orr // Shutterstock
#36. Colorado
Mountain views in downtown Telluride, Colorado.
– Change from 1980: -0.3 percentage points
– Change from 2021: -0.3 percentage points
– State-local effective tax rate 2022: 9.7%
– State-local tax burden per capita: $6,699

Kevin Ruck // Shutterstock
#35. North Carolina
An aerial view of Winston-Salem, North Carolina.
– Change from 1980: -0.3 percentage points
– Change from 2021: -0.2 percentage points
– State-local effective tax rate 2022: 9.9%
– State-local tax burden per capita: $5,299

Canva
#34. Kentucky
Louisville, Kentucky, at night.
– Change from 1980: -0.2 percentage points
– Change from 2021: -0.4 percentage points
– State-local effective tax rate 2022: 9.6%
– State-local tax burden per capita: $4,669
Ramunas Bruzas // Shutterstock
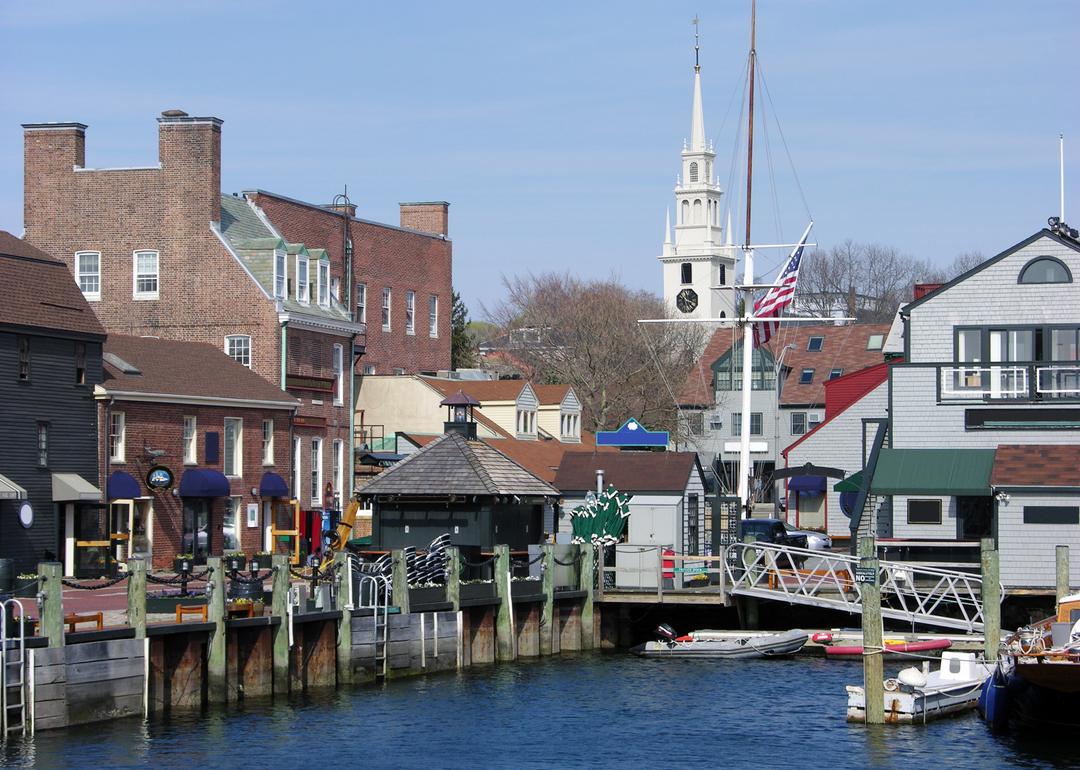
#33. Rhode Island
Old harbor in Newport, Rhode Island.
– Change from 1980: -0.2 percentage points
– Change from 2021: -0.3 percentage points
– State-local effective tax rate 2022: 11.4%
– State-local tax burden per capita: $6,948

Paul Brady Photography // Shutterstock
#32. Missouri
The St. Louis Gateway Arch in Missouri.
– Change from 1980: -0.1 percentage points
– Change from 2021: -0.1 percentage points
– State-local effective tax rate 2022: 9.3%
– State-local tax burden per capita: $4,953

Sean Pavone // Shutterstock
#31. Pennsylvania
The Pittsburgh skyline as viewed from the hills.
– Change from 1980: -0.1 percentage points
– Change from 2021: -0.1 percentage points
– State-local effective tax rate 2022: 10.6%
– State-local tax burden per capita: $6,723

Canva
#30. Idaho
Boise, Idaho.
– Change from 1980: +0.2 percentage points
– Change from 2021: -0.1 percentage points
– State-local effective tax rate 2022: 10.7%
– State-local tax burden per capita: $5,402
TLF Images // Shutterstock
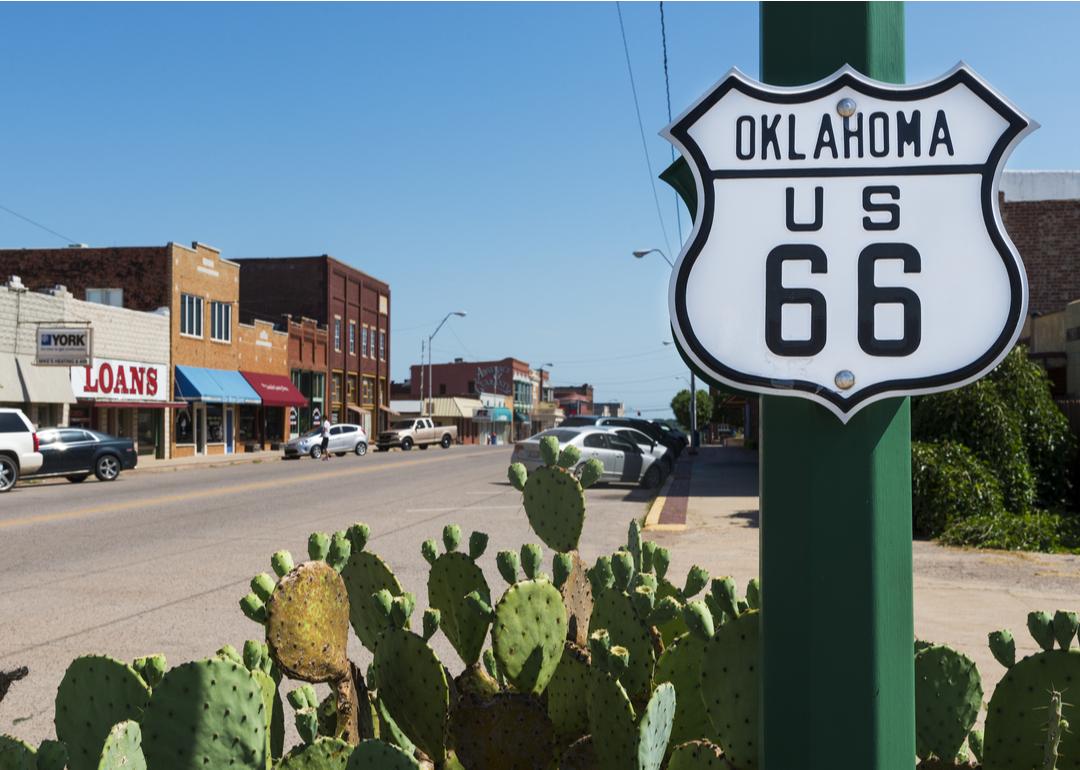
#29. Oklahoma
US Route 66 in Oklahoma.
– Change from 1980: +0.3 percentage points
– Change from 2021: 0.0 percentage points
– State-local effective tax rate 2022: 9.0%
– State-local tax burden per capita: $4,527

Canva
#28. Mississippi
Jackson, Mississippi.
– Change from 1980: +0.4 percentage points
– Change from 2021: 0.0 percentage points
– State-local effective tax rate 2022: 9.8%
– State-local tax burden per capita: $4,220
FotosForTheFuture // Shutterstock
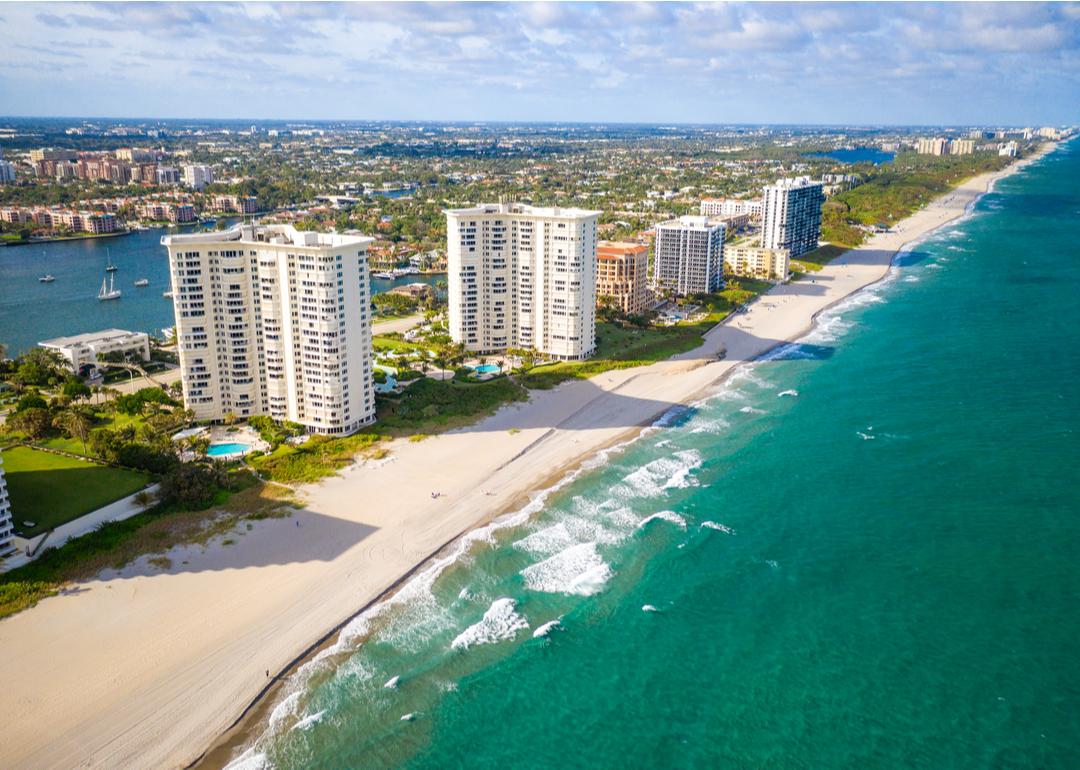
#27. Florida
An aerial view of Boca Raton, Florida.
– Change from 1980: +0.4 percentage points
– Change from 2021: 0.0 percentage points
– State-local effective tax rate 2022: 9.1%
– State-local tax burden per capita: $5,406
Canva
#26. Iowa
Iowa City, Iowa.
– Change from 1980: +0.5 percentage points
– Change from 2021: -0.3 percentage points
– State-local effective tax rate 2022: 11.2%
– State-local tax burden per capita: $6,086

Canva
#25. Alabama
The Mobile, Alabama, skyline.
– Change from 1980: +0.5 percentage points
– Change from 2021: -0.2 percentage points
– State-local effective tax rate 2022: 9.8%
– State-local tax burden per capita: $4,585

Canva
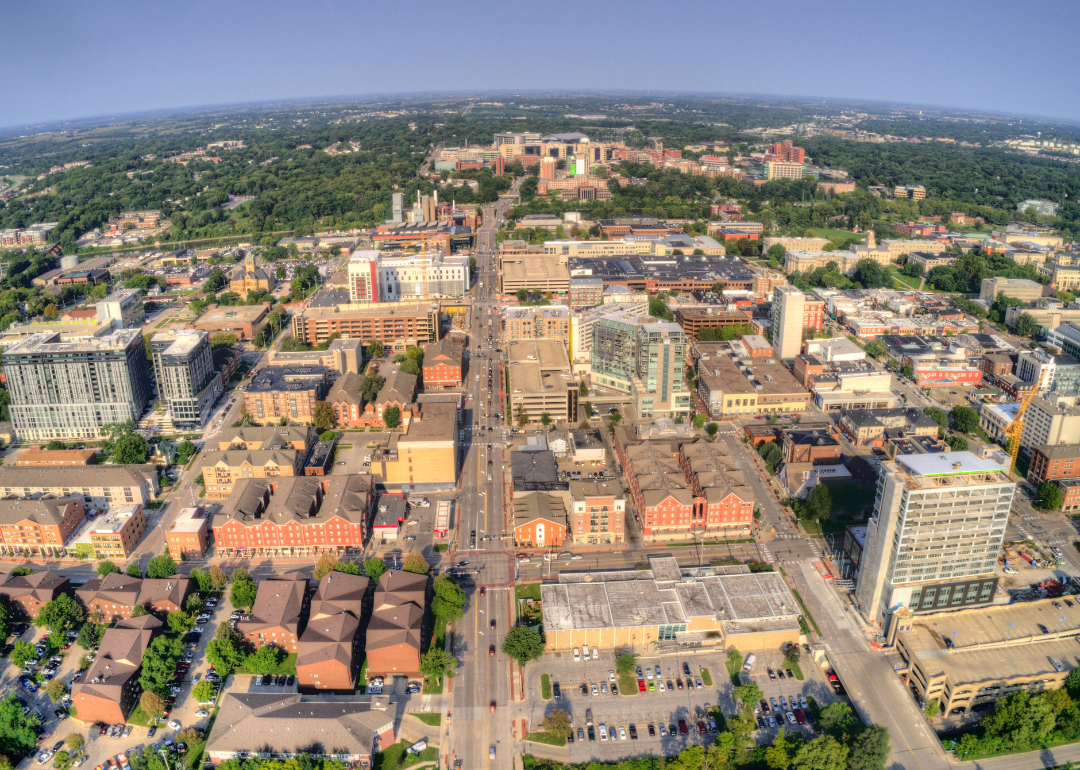
#24. Nebraska
Omaha, Nebraska.
– Change from 1980: +0.7 percentage points
– Change from 2021: -0.2 percentage points
– State-local effective tax rate 2022: 11.5%
– State-local tax burden per capita: $6,720

Canva
#23. Ohio
Columbus, Ohio, at night.
– Change from 1980: +0.8 percentage points
– Change from 2021: -0.4 percentage points
– State-local effective tax rate 2022: 10.0%
– State-local tax burden per capita: $5,530

turtix // Shutterstock
#22. New Mexico
Residential suburbs in Albuquerque, New Mexico.
– Change from 1980: +0.9 percentage points
– Change from 2021: -0.3 percentage points
– State-local effective tax rate 2022: 10.2%
– State-local tax burden per capita: $4,835
Canva
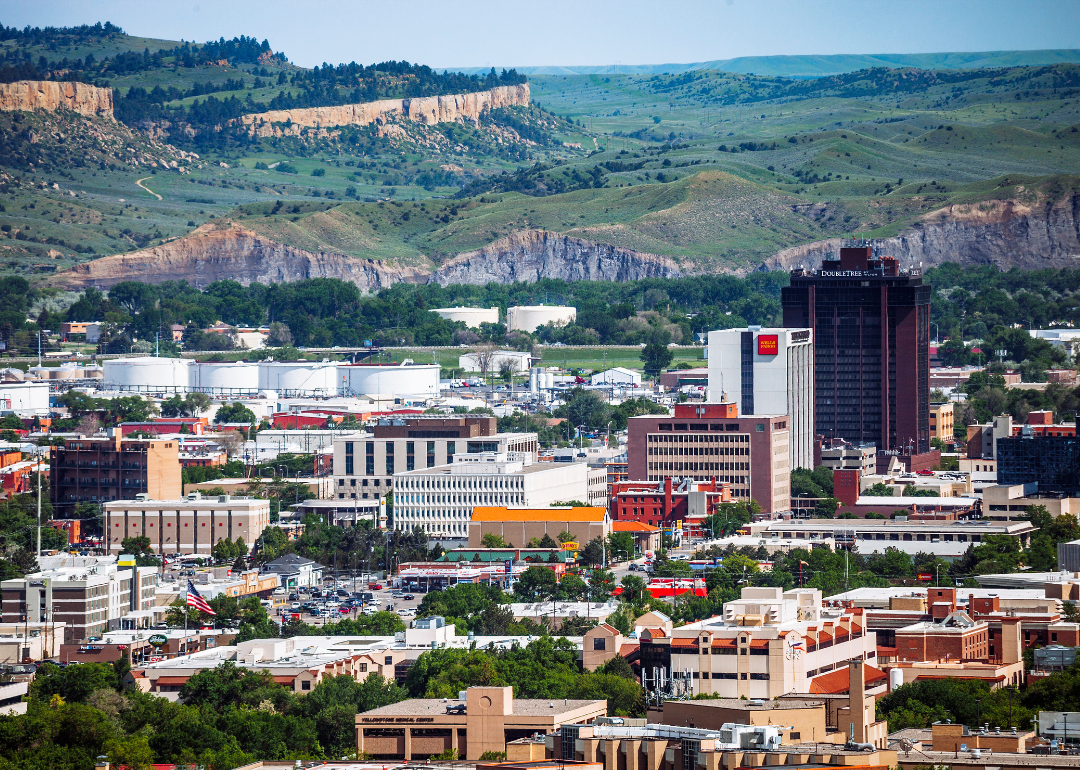
#21. Montana
Billings, Montana.
– Change from 1980: +0.9 percentage points
– Change from 2021: -0.2 percentage points
– State-local effective tax rate 2022: 10.5%
– State-local tax burden per capita: $5,795

Roschetzky Photography // Shutterstock
#20. Texas
An aerial view of Austin, Texas, and Lady Bird Lake.
– Change from 1980: +0.9 percentage points
– Change from 2021: +0.2 percentage points
– State-local effective tax rate 2022: 8.6%
– State-local tax burden per capita: $4,994

Trong Nguyen // Shutterstock
#19. Arkansas
A scenic suburb in Ozark, Arkansas.
– Change from 1980: +1.0 percentage points
– Change from 2021: -0.5 percentage points
– State-local effective tax rate 2022: 10.2%
– State-local tax burden per capita: $5,031

Canva
#18. Indiana
Indianapolis.
– Change from 1980: +1.0 percentage points
– Change from 2021: 0.0 percentage points
– State-local effective tax rate 2022: 9.3%
– State-local tax burden per capita: $5,030

Jason Finn // Shutterstock
#17. Utah
Homes in Highland, Utah, in a prime neighborhood with mountain and sky views.
– Change from 1980: +1.0 percentage points
– Change from 2021: +0.2 percentage points
– State-local effective tax rate 2022: 12.1%
– State-local tax burden per capita: $6,750

Max Lindenthaler // Shutterstock
#16. Washington
The Seattle skyline near sundown—featuring the Spack Needle and Mt. Rainier.
– Change from 1980: +1.1 percentage points
– Change from 2021: -0.3 percentage points
– State-local effective tax rate 2022: 10.7%
– State-local tax burden per capita: $7,803

Canva
#15. Louisiana
New Orleans.
– Change from 1980: +1.1 percentage points
– Change from 2021: 0.0 percentage points
– State-local effective tax rate 2022: 9.1%
– State-local tax burden per capita: $4,762

Wangkun Jia // Shutterstock
#14. New Hampshire
City Hall in downtown Concord, New Hampshire.
– Change from 1980: +1.1 percentage points
– Change from 2021: +0.1 percentage points
– State-local effective tax rate 2022: 9.6%
– State-local tax burden per capita: $6,593

f11photo // Shutterstock
#13. New Jersey
An aerial view of Jersey City at sunset.
– Change from 1980: +1.1 percentage points
– Change from 2021: +0.2 percentage points
– State-local effective tax rate 2022: 13.2%
– State-local tax burden per capita: $9,648

Sandra Burm // Shutterstock
#12. Minnesota
A street view of downtown Stillwater, Minnesota.
– Change from 1980: +1.2 percentage points
– Change from 2021: -0.3 percentage points
– State-local effective tax rate 2022: 12.1%
– State-local tax burden per capita: $7,763

Canva
#11. Maine
The waterfront in Portland, Maine.
– Change from 1980: +1.5 percentage points
– Change from 2021: 0.0 percentage points
– State-local effective tax rate 2022: 12.4%
– State-local tax burden per capita: $6,906

Canva
#10. Kansas
Wichita, Kansas.
– Change from 1980: +1.6 percentage points
– Change from 2021: +0.1 percentage points
– State-local effective tax rate 2022: 11.2%
– State-local tax burden per capita: $6,353

Jacob Boomsma // Shutterstock
#9. Nevada
An aerial View of Carson City, Nevada.
– Change from 1980: +1.8 percentage points
– Change from 2021: -0.3 percentage points
– State-local effective tax rate 2022: 9.6%
– State-local tax burden per capita: $5,554

Real Window Creative // Shutterstock
#8. Delaware
An aerial view of downtown Wilmington, Delaware.
– Change from 1980: +2.1 percentage points
– Change from 2021: +0.2 percentage points
– State-local effective tax rate 2022: 12.4%
– State-local tax burden per capita: $7,170
Rigucci // Shutterstock
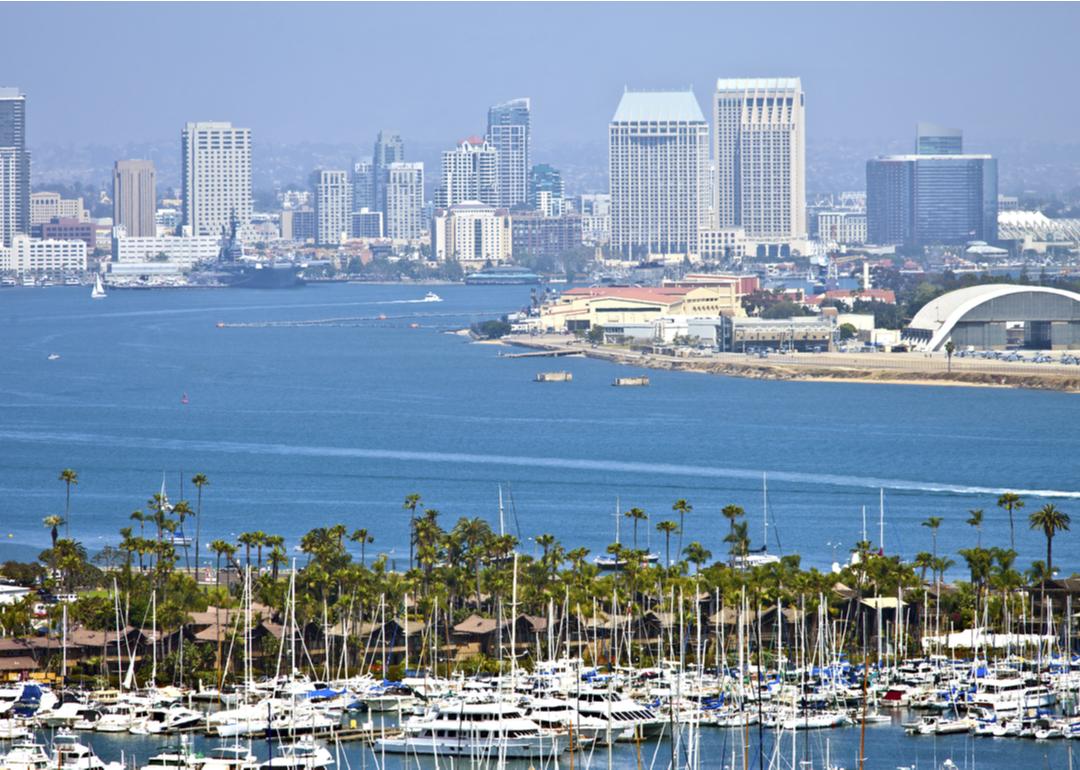
#7. California
The San Diego skyline, as viewed from Point Loma Island, California.
– Change from 1980: +2.1 percentage points
– Change from 2021: +0.2 percentage points
– State-local effective tax rate 2022: 13.5%
– State-local tax burden per capita: $10,167

Canva
#6. Virginia
The skyline of Richmond, Virginia.
– Change from 1980: +2.1 percentage points
– Change from 2021: +0.1 percentage points
– State-local effective tax rate 2022: 12.5%
– State-local tax burden per capita: $7,979

DiegoMariottini // Shutterstock
#5. Illinois
Skyscrapers and Lake Michigan in Chicago.
– Change from 1980: +2.3 percentage points
– Change from 2021: 0.0 percentage points
– State-local effective tax rate 2022: 12.9%
– State-local tax burden per capita: $8,390

GagliardiPhotography // Shutterstock
#4. New York
A cityscape view of Lower Manhattan in New York.
– Change from 1980: +2.7 percentage points
– Change from 2021: +0.7 percentage points
– State-local effective tax rate 2022: 15.9%
– State-local tax burden per capita: $12,083

Sean Pavone // Shutterstock
#3. Vermont
Montpelier, Vermont, in autumn.
– Change from 1980: +2.8 percentage points
– Change from 2021: +0.2 percentage points
– State-local effective tax rate 2022: 13.6%
– State-local tax burden per capita: $7,958

Canva
#2. Hawaii
Honolulu.
– Change from 1980: +3.1 percentage points
– Change from 2021: +0.2 percentage points
– State-local effective tax rate 2022: 14.1%
– State-local tax burden per capita: $8,410

James Kirkikis // Shutterstock
#1. Connecticut
A sailboat moored in front of a luxury waterfront estate in Greenwich, Connecticut.
– Change from 1980: +4.9 percentage points
– Change from 2021: +0.7 percentage points
– State-local effective tax rate 2022: 15.4%
– State-local tax burden per capita: $12,151