
How auto insurance rates have changed over the past decades
Piyawat Nandeenopparit // Shutterstock
How auto insurance rates have changed over the past decades
Auto insurance is a necessity with car ownership. But doesn’t it seem as if paying it always takes a huge chunk out of your wallet?
You’re not wrong. Auto insurance policy prices are based on a number of factors, including your driving record, age, gender, where you live, how much you drive, and what kind of car you drive. If you’re a safe driver and don’t put a lot of miles on your car—or have a car that’s cheaper to maintain—your insurance rates should be lower over time.
However, insurance rates don’t just look at individuals; they also look at other drivers and calculate the risk of insuring you compared to them. If the number of accidents in your area goes up over time, the price of your insurance policy may increase too. Cars have also become more sophisticated. Onboard computers with touch screens and heated seats are features that have made cars more complicated to repair, which also factors into insurance pricing.
If you presume that you’ll be driving for several decades, it’s helpful to understand just how much costs have changed over time. Cheapinsurance.com collected information on insurance premiums from the Bureau of Labor Statistics Consumer Price Index data, looking at prices during each decade since the 1970s. The index of insurance premiums is for urban insurance consumers and includes a range of coverage and vehicle types, each weighted based on their importance. Full details on the index methodology can be found here. The 2022 data is only available through March, so the yearly average is based on three months. Prices are not adjusted for inflation since these numbers come from the Consumer Price Index.
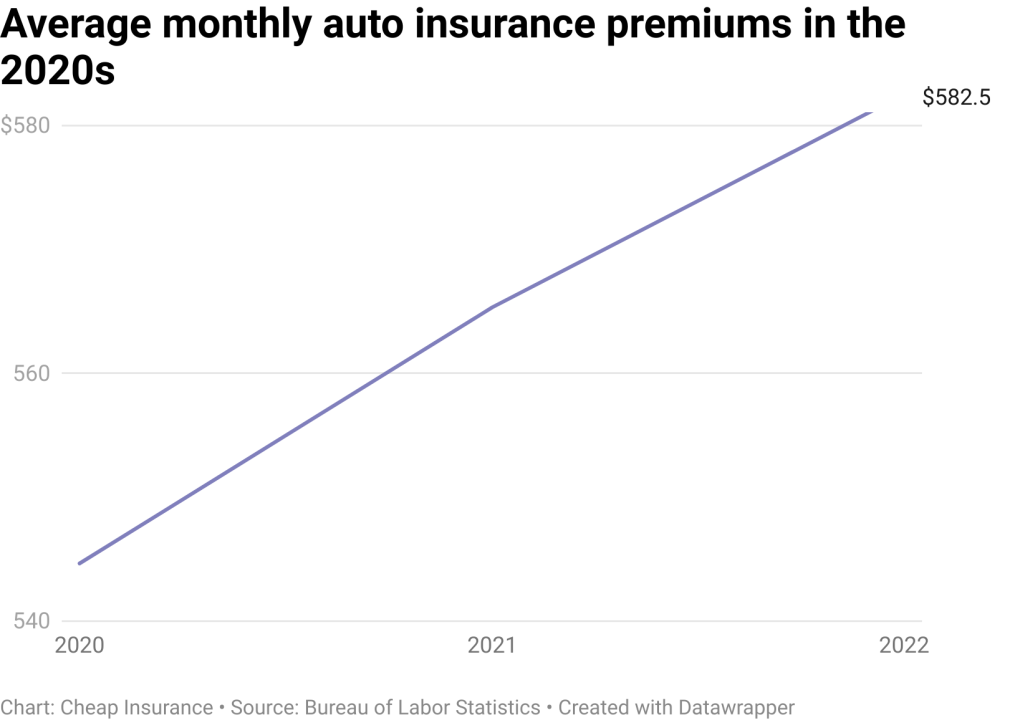
The data may surprise you. Though costs may seem high today, 2020 actually had the largest decrease in insurance premiums of this whole period—and one of the very few decreases on record in the last few decades. This was likely due to the COVID-19 pandemic, when businesses closed down during lockdowns and many companies allowed employees to work from home. Consumers cut down on their driving, which led to reduced traffic—and lower insurance costs.
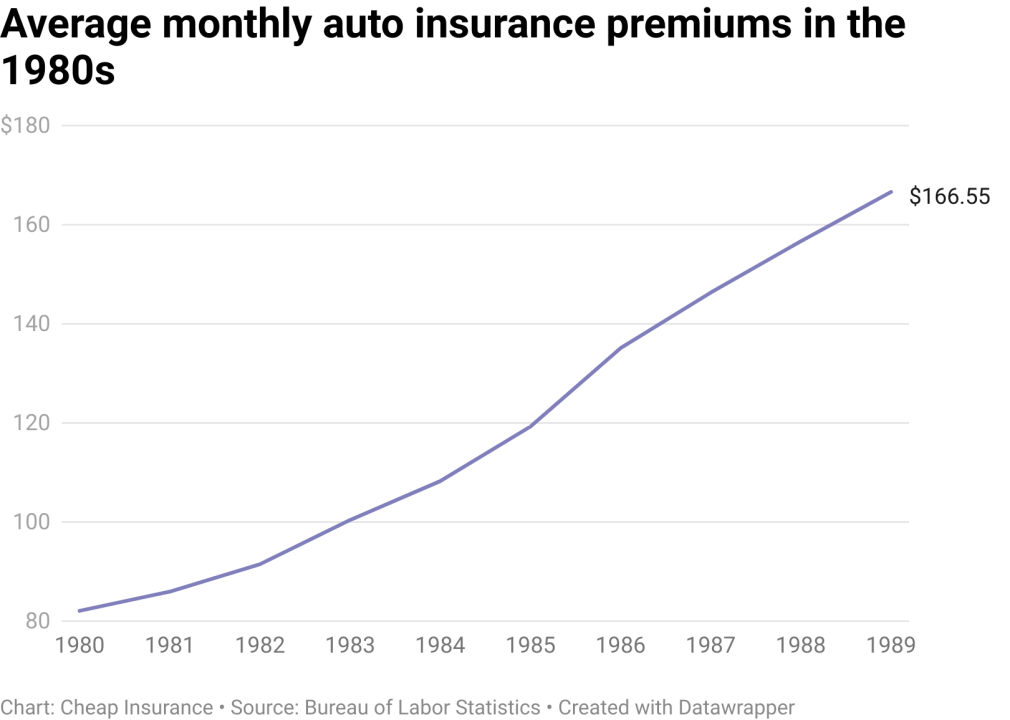
However, if you were driving back in the 1980s, you experienced a different reality, as this decade saw the largest percent increase in insurance premiums. Between 1980 and 1989, the average driver saw their premiums more than double.
Read on to see how insurance costs have changed throughout the decades. Find out if you’re better off now or if the “good old days” really were much better.
![]()
Matt Albasi // Stacker
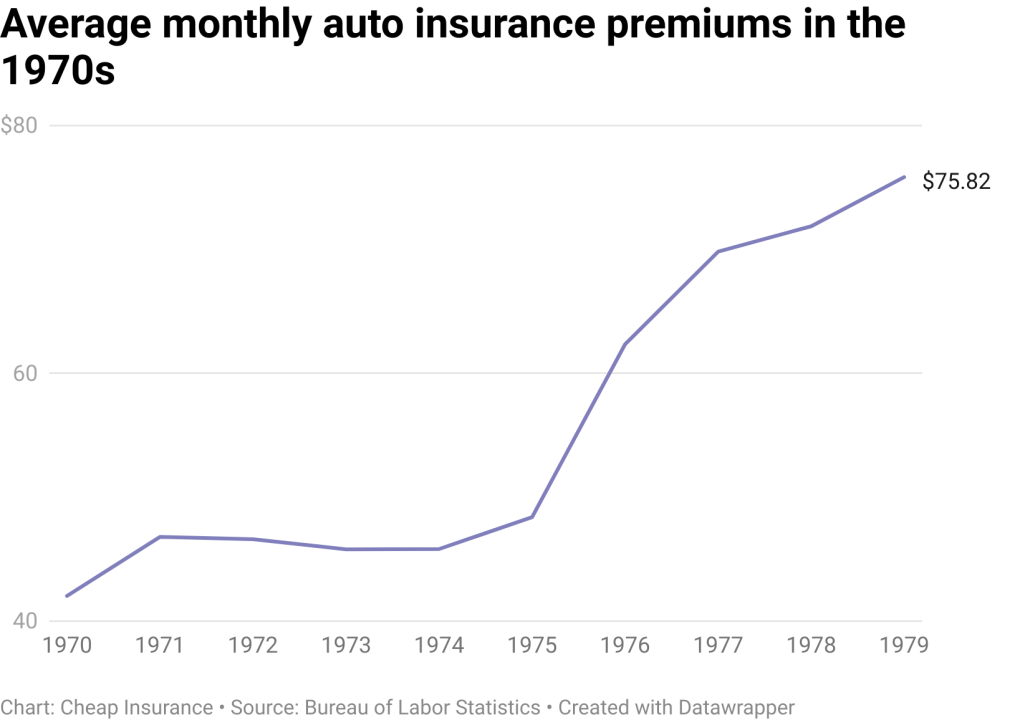
1970s
– Average monthly insurance premium: $56
– Premium increase from start of decade: $34 (up 80%)
Matt Albasi // Stacker
1980s
– Average monthly insurance premium: $119
– Premium increase from start of decade: $85 (103%)
Matt Albasi // Stacker
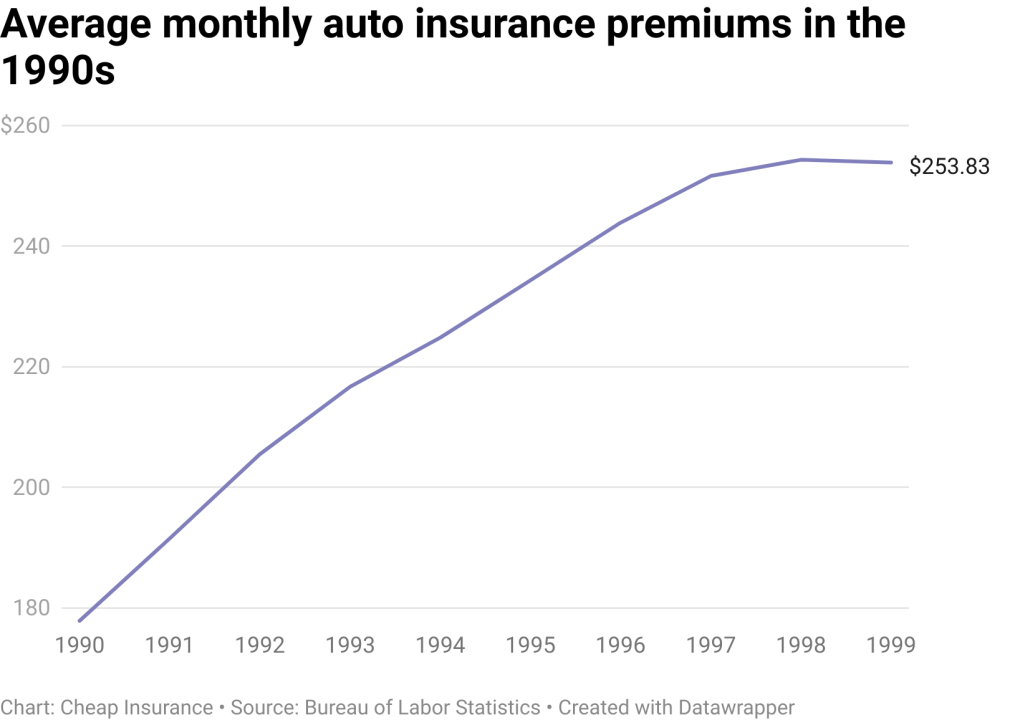
1990s
– Average monthly insurance premium: $225
– Premium increase from start of decade: $76 (43%)
Matt Albasi // Stacker
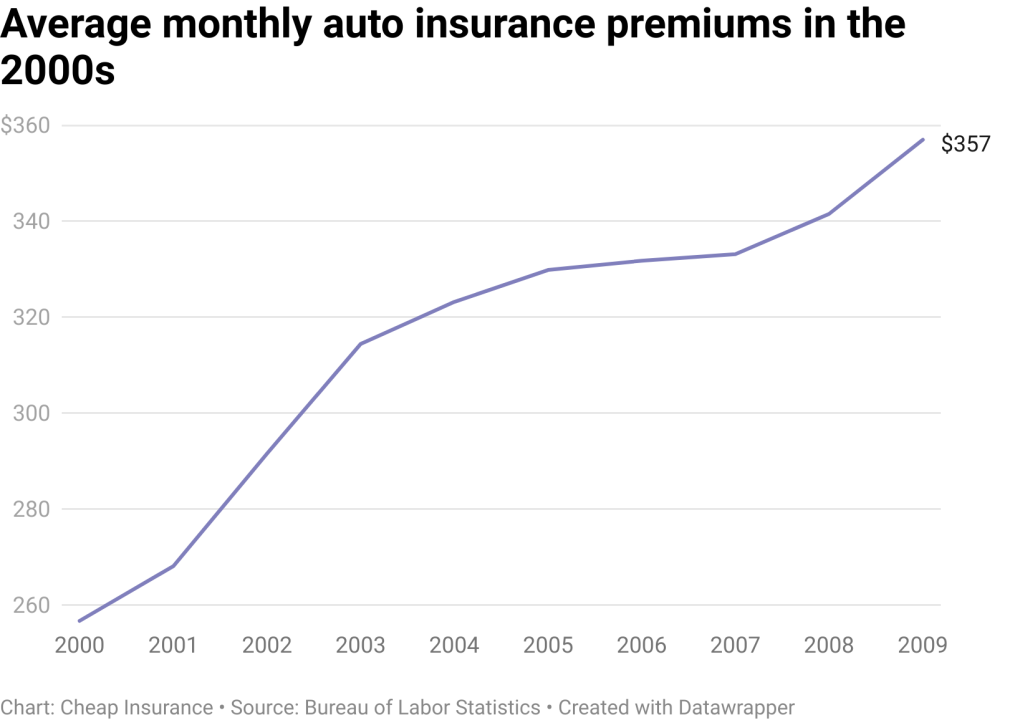
2000s
– Average monthly insurance premium: $315
– Premium increase from start of decade: $100 (39%)
Matt Albasi // Stacker
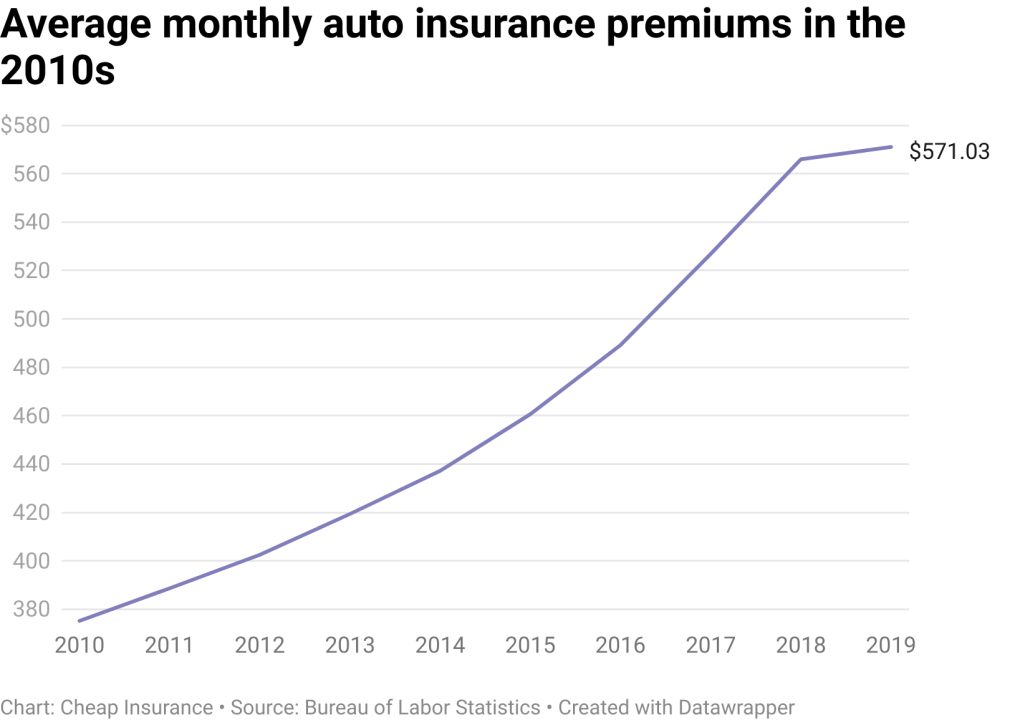
2010s
– Average monthly insurance premium: $464
– Premium increase from start of decade: $196 (52%)
Matt Albasi // Stacker
2020s
– Average monthly insurance premium: $564
– Premium increase from start of decade: $38 (7%)
This story originally appeared on Cheapinsurance.com
and was produced and distributed in partnership with Stacker Studio.