
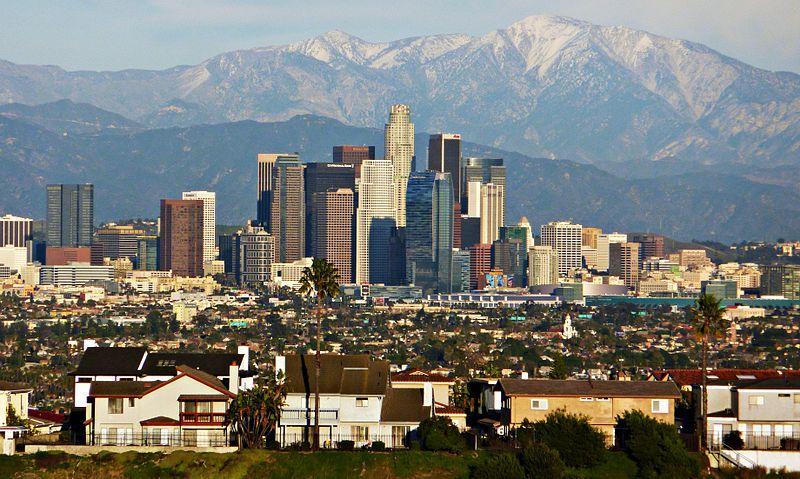
Where people in Los Angeles are moving to most
BDS2006 // Wikimedia
Where people in Los Angeles are moving to most
Stacker compiled a list of where people in Los Angeles-Long Beach-Anaheim, CA Metro Area are moving to the most using data from the U.S. Census Bureau. Metros are ranked by the estimated number of people who moved to the metro from Los Angeles between 2015 and 2019. Ties were broken by gross migration.
You may also like: Highest-rated breakfast restaurants in Los Angeles, according to Tripadvisor
![]()
Ron Reiring // Wikicommons
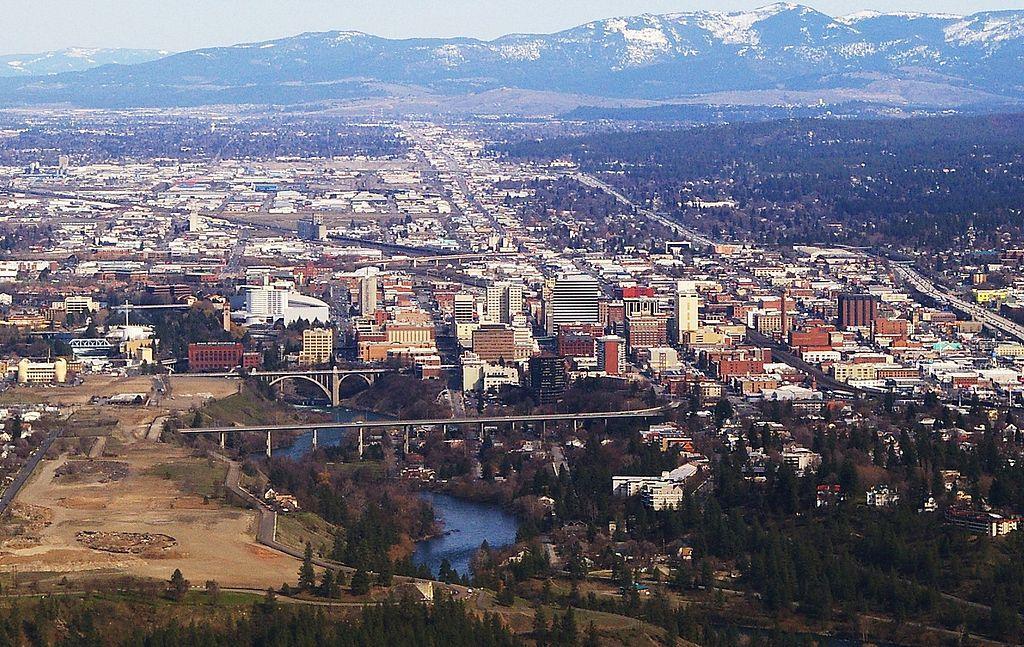
#50. Spokane-Spokane Valley, WA Metro Area
– Migration to Spokane in 2015-2019: 1,082
– Migration from Spokane to Los Angeles: 356 (#11 most common destination from Spokane)
– Net migration: 726 to Spokane
LPS.1 // Wikicommons
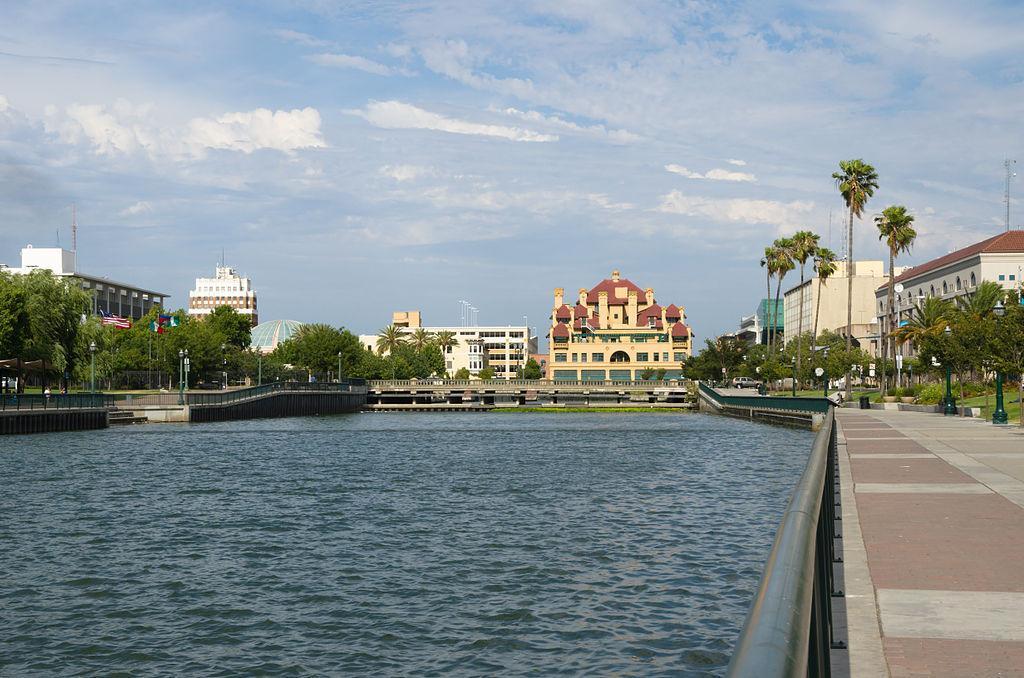
#49. Stockton, CA Metro Area
– Migration to Stockton in 2015-2019: 1,115
– Migration from Stockton to Los Angeles: 707 (#6 most common destination from Stockton)
– Net migration: 408 to Stockton
Matt314 // Wikicommons
#48. Santa Rosa-Petaluma, CA Metro Area
– Migration to Santa Rosa in 2015-2019: 1,132
– Migration from Santa Rosa to Los Angeles: 738 (#3 most common destination from Santa Rosa)
– Net migration: 394 to Santa Rosa
Lómelinde // Wikicommons
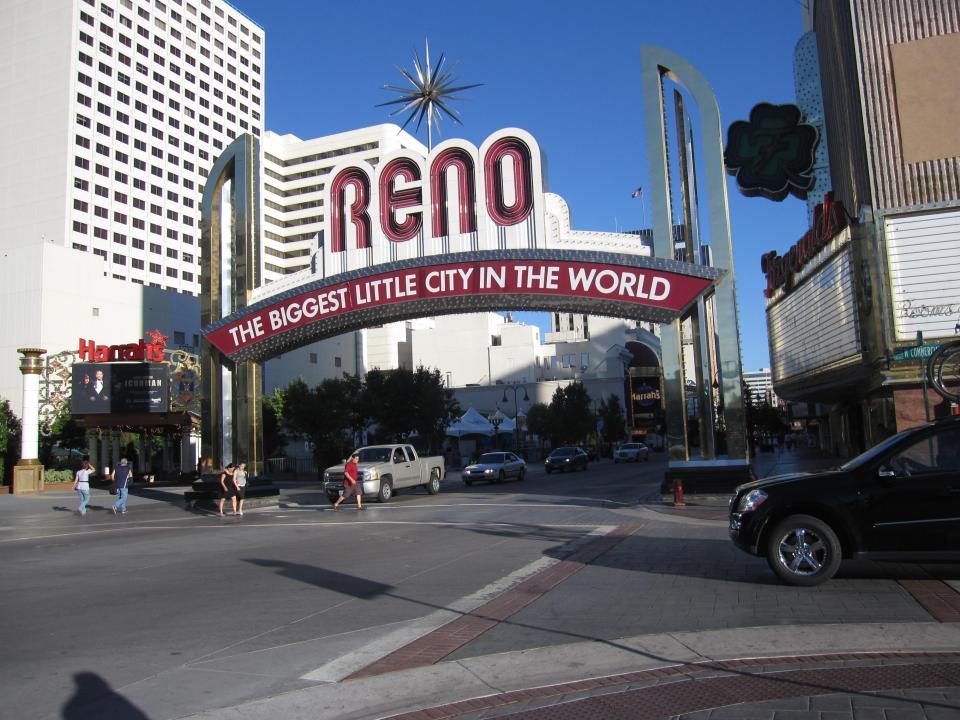
#47. Reno, NV Metro Area
– Migration to Reno in 2015-2019: 1,156
– Migration from Reno to Los Angeles: 417 (#9 most common destination from Reno)
– Net migration: 739 to Reno

Famartin // Wikicommons
#46. Baltimore-Columbia-Towson, MD Metro Area
– Migration to Baltimore in 2015-2019: 1,187
– Migration from Baltimore to Los Angeles: 1,656 (#7 most common destination from Baltimore)
– Net migration: 469 to Los Angeles
You may also like: Highest and lowest paying education jobs in Los Angeles

Sherry V Smith // Shutterstock
#45. Virginia Beach-Norfolk-Newport News, VA-NC Metro Area
– Migration to Virginia Beach in 2015-2019: 1,214
– Migration from Virginia Beach to Los Angeles: 677 (#30 most common destination from Virginia Beach)
– Net migration: 537 to Virginia Beach

Robert Corby // Wikimedia Commons
#44. Colorado Springs, CO Metro Area
– Migration to Colorado Springs in 2015-2019: 1,221
– Migration from Colorado Springs to Los Angeles: 1,162 (#4 most common destination from Colorado Springs)
– Net migration: 59 to Colorado Springs

California Droning // Shutterstock
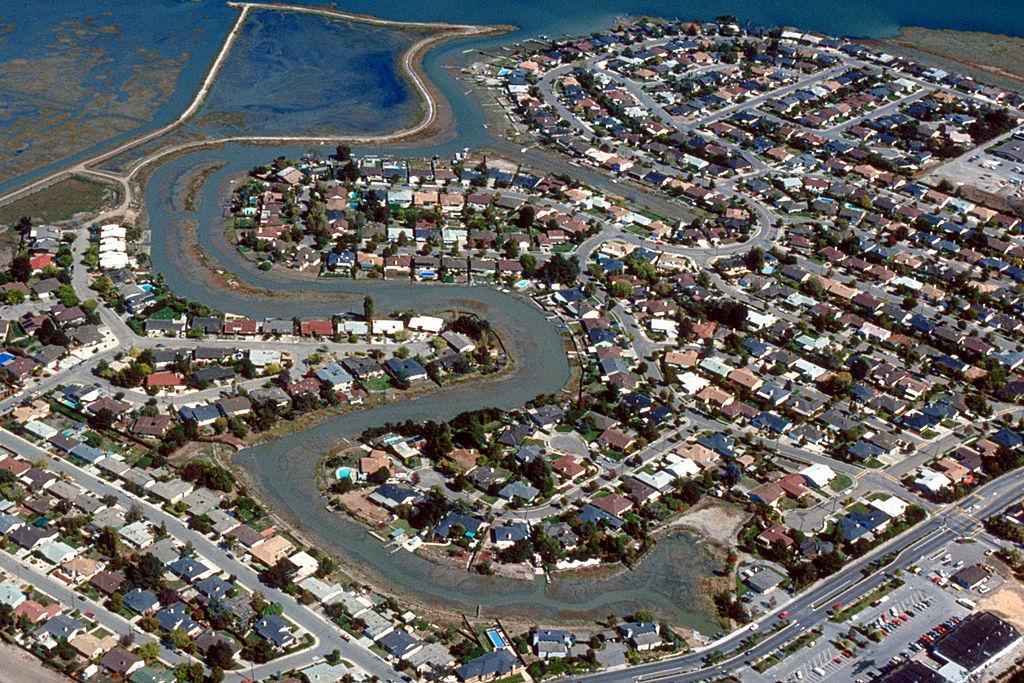
#43. Vallejo, CA Metro Area
– Migration to Vallejo in 2015-2019: 1,244
– Migration from Vallejo to Los Angeles: 803 (#4 most common destination from Vallejo)
– Net migration: 441 to Vallejo
Derek.cashman // Wikicommons
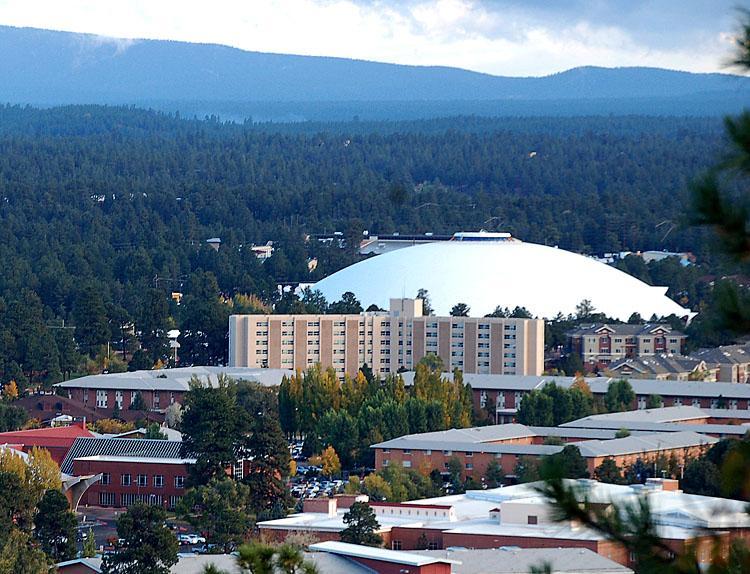
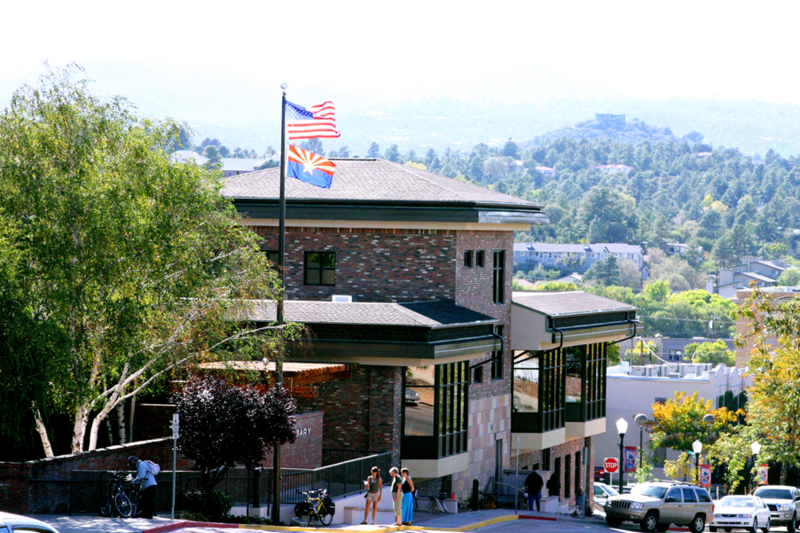
#42. Flagstaff, AZ Metro Area
– Migration to Flagstaff in 2015-2019: 1,261
– Migration from Flagstaff to Los Angeles: 332 (#7 most common destination from Flagstaff)
– Net migration: 929 to Flagstaff

BusinessEditorUSA // Wikimedia Commons
#41. Charlotte-Concord-Gastonia, NC-SC Metro Area
– Migration to Charlotte in 2015-2019: 1,324
– Migration from Charlotte to Los Angeles: 1,225 (#17 most common destination from Charlotte)
– Net migration: 99 to Charlotte
You may also like: Highest-rated Italian restaurants in Los Angeles, according to Tripadvisor
Lauram12345 // Wikicommons
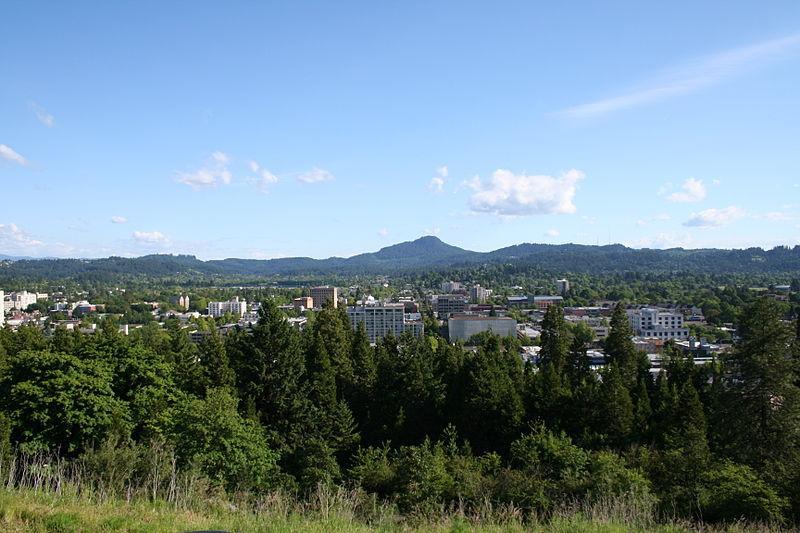
#40. Eugene-Springfield, OR Metro Area
– Migration to Eugene in 2015-2019: 1,345
– Migration from Eugene to Los Angeles: 348 (#9 most common destination from Eugene)
– Net migration: 997 to Eugene
![]()
VISALIA2010 // Wikicommons
#39. Visalia, CA Metro Area
– Migration to Visalia in 2015-2019: 1,356
– Migration from Visalia to Los Angeles: 926 (#4 most common destination from Visalia)
– Net migration: 430 to Visalia
Naotake Murayama // Wikicommons
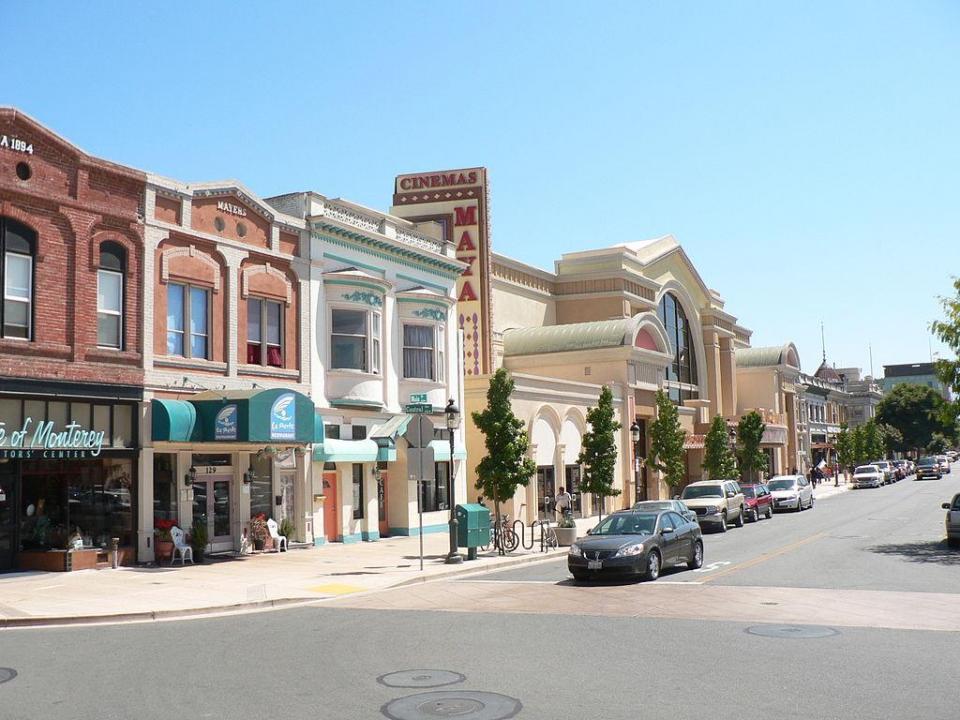
#38. Salinas, CA Metro Area
– Migration to Salinas in 2015-2019: 1,396
– Migration from Salinas to Los Angeles: 1,290 (#2 most common destination from Salinas)
– Net migration: 106 to Salinas
Public Domain
#37. Madera, CA Metro Area
– Migration to Madera in 2015-2019: 1,400
– Migration from Madera to Los Angeles: 196 (#8 most common destination from Madera)
– Net migration: 1,204 to Madera
Martha.baden // Wikimedia
#36. Prescott Valley-Prescott, AZ Metro Area
– Migration to Prescott Valley in 2015-2019: 1,435
– Migration from Prescott Valley to Los Angeles: 260 (#6 most common destination from Prescott Valley)
– Net migration: 1,175 to Prescott Valley
You may also like: Highest-rated Mexican restaurants in Los Angeles, according to Tripadvisor

InSapphoWeTrust // Wikicommons
#35. Lake Havasu City-Kingman, AZ Metro Area
– Migration to Lake Havasu City in 2015-2019: 1,473
– Migration from Lake Havasu City to Los Angeles: 333 (#7 most common destination from Lake Havasu City)
– Net migration: 1,140 to Lake Havasu City

f11photo // Shutterstock
#34. Philadelphia-Camden-Wilmington, PA-NJ-DE-MD Metro Area
– Migration to Philadelphia in 2015-2019: 1,617
– Migration from Philadelphia to Los Angeles: 2,963 (#15 most common destination from Philadelphia)
– Net migration: 1,346 to Los Angeles
Aaronbrick // Wikicommons
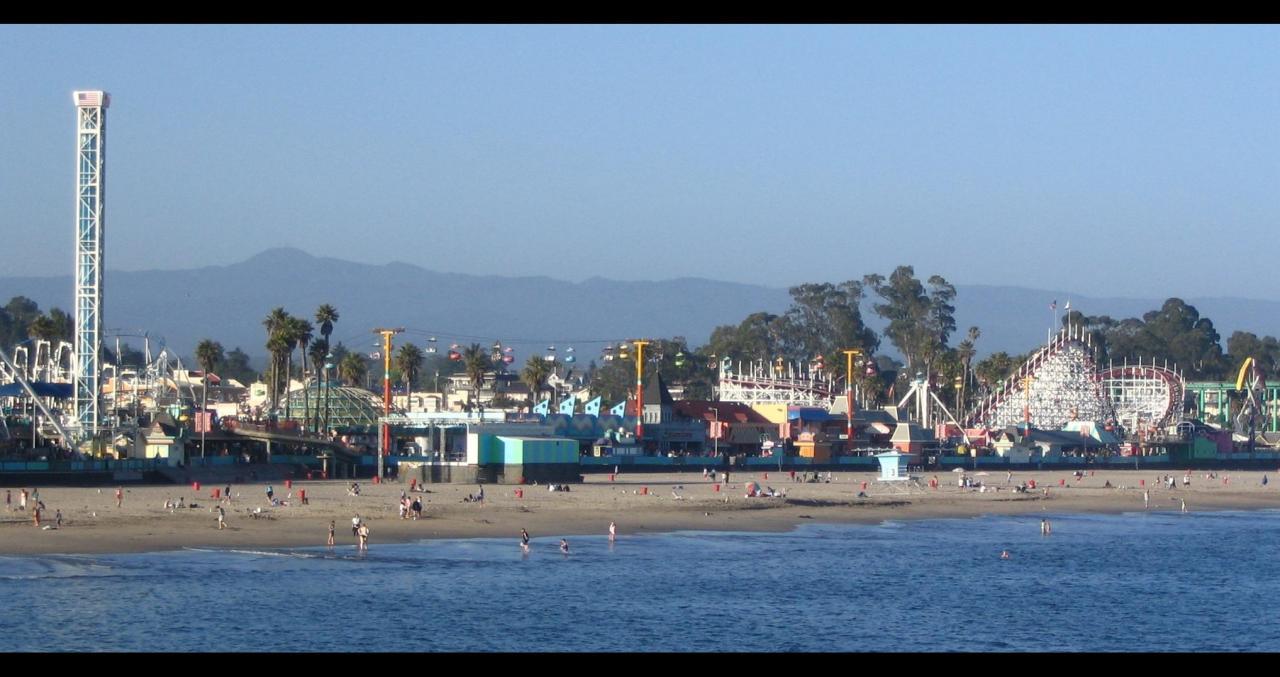
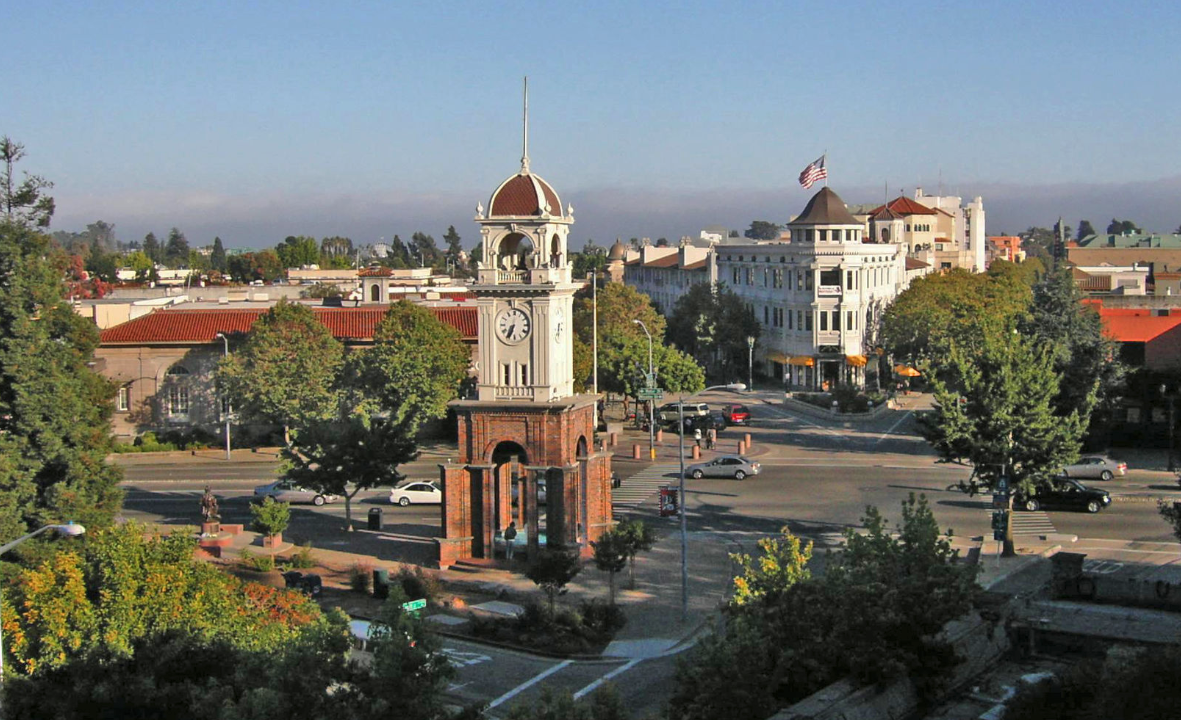
#33. Santa Cruz-Watsonville, CA Metro Area
– Migration to Santa Cruz in 2015-2019: 1,644
– Migration from Santa Cruz to Los Angeles: 1,019 (#4 most common destination from Santa Cruz)
– Net migration: 625 to Santa Cruz
Skyguy414 // Wikicommons
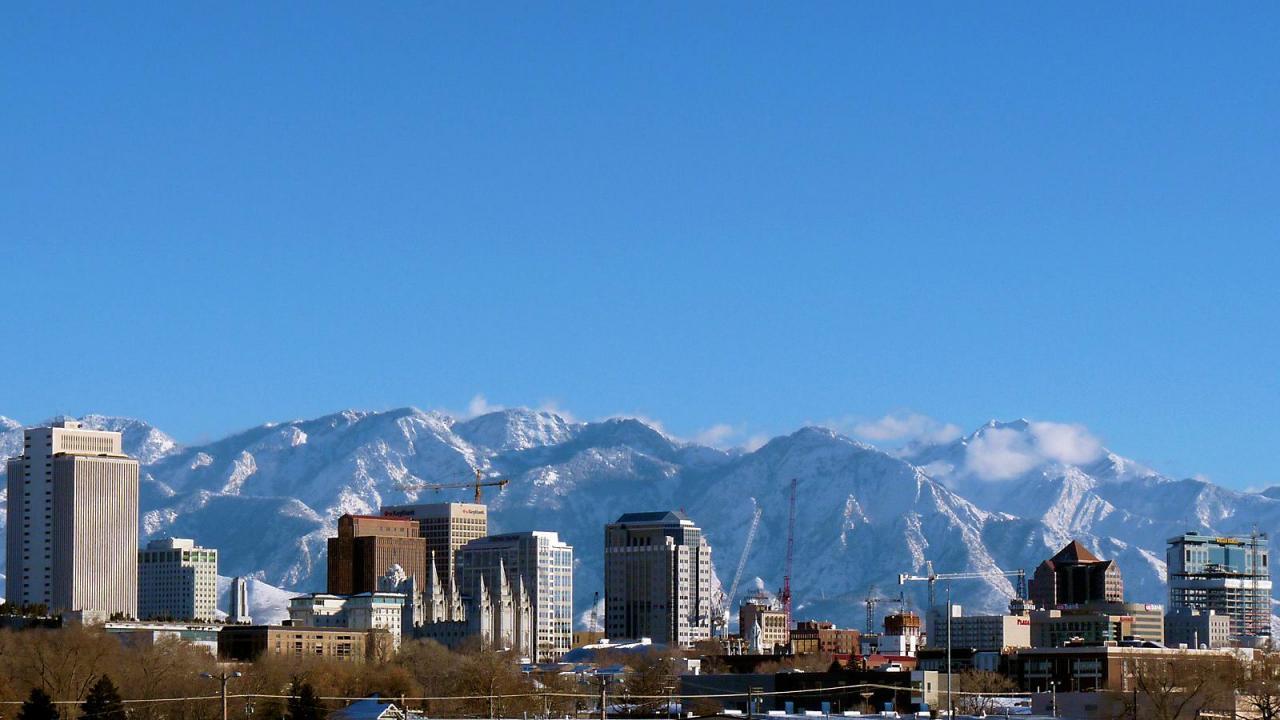
#32. Salt Lake City, UT Metro Area
– Migration to Salt Lake City in 2015-2019: 1,655
– Migration from Salt Lake City to Los Angeles: 1,222 (#6 most common destination from Salt Lake City)
– Net migration: 433 to Salt Lake City

Ben P L // Wikimedia Commons
#31. Provo-Orem, UT Metro Area
– Migration to Provo in 2015-2019: 1,657
– Migration from Provo to Los Angeles: 584 (#9 most common destination from Provo)
– Net migration: 1,073 to Provo
You may also like: Highest and lowest paying health care jobs in Los Angeles
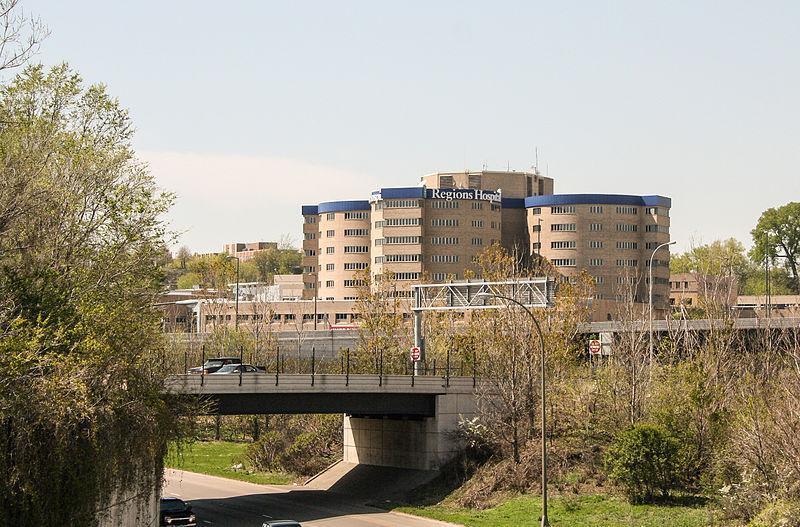
Tony Webster // Wikicommons
#30. Minneapolis-St. Paul-Bloomington, MN-WI Metro Area
– Migration to Minneapolis in 2015-2019: 1,698
– Migration from Minneapolis to Los Angeles: 1,820 (#9 most common destination from Minneapolis)
– Net migration: 122 to Los Angeles

f11photo // Shutterstock
#29. Nashville-Davidson–Murfreesboro–Franklin, TN Metro Area
– Migration to Nashville in 2015-2019: 2,030
– Migration from Nashville to Los Angeles: 1,177 (#8 most common destination from Nashville)
– Net migration: 853 to Nashville

Pixabay
#28. San Antonio-New Braunfels, TX Metro Area
– Migration to San Antonio in 2015-2019: 2,053
– Migration from San Antonio to Los Angeles: 763 (#19 most common destination from San Antonio)
– Net migration: 1,290 to San Antonio
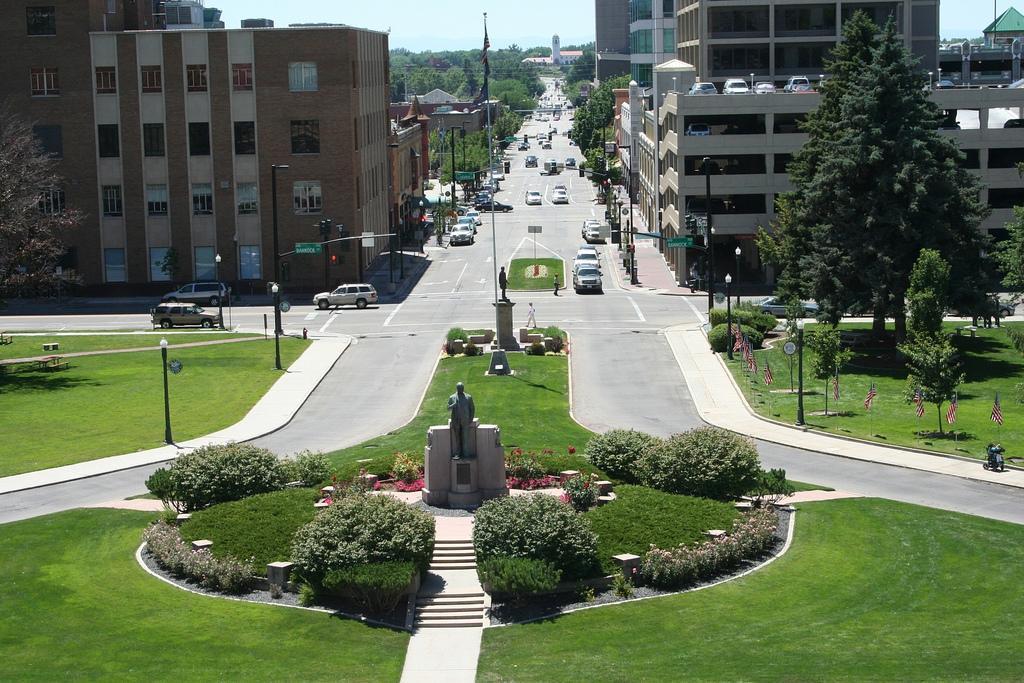
Boise Metro Chamber // Flickr
#27. Boise City, ID Metro Area
– Migration to Boise City in 2015-2019: 2,210
– Migration from Boise City to Los Angeles: 430 (#9 most common destination from Boise City)
– Net migration: 1,780 to Boise City
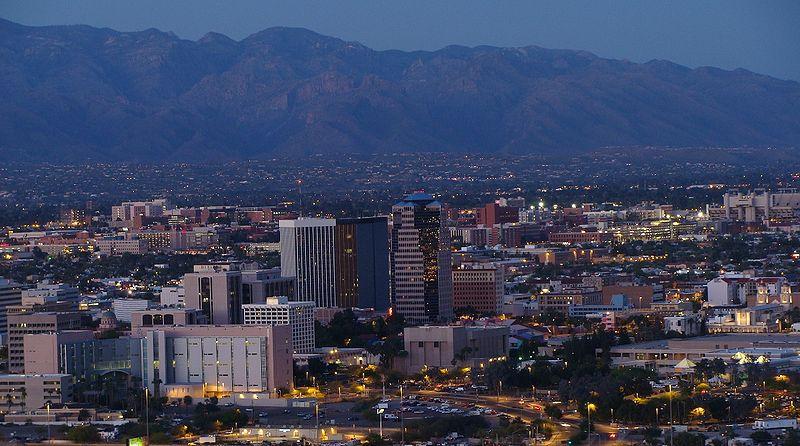
Zereshk // Wikimedia
#26. Tucson, AZ Metro Area
– Migration to Tucson in 2015-2019: 2,319
– Migration from Tucson to Los Angeles: 1,029 (#3 most common destination from Tucson)
– Net migration: 1,290 to Tucson
You may also like: Metros sending the most people to Los Angeles

Edmund Garman // Flickr
#25. Urban Honolulu, HI Metro Area
– Migration to Urban Honolulu in 2015-2019: 2,526
– Migration from Urban Honolulu to Los Angeles: 2,229 (#2 most common destination from Urban Honolulu)
– Net migration: 297 to Urban Honolulu
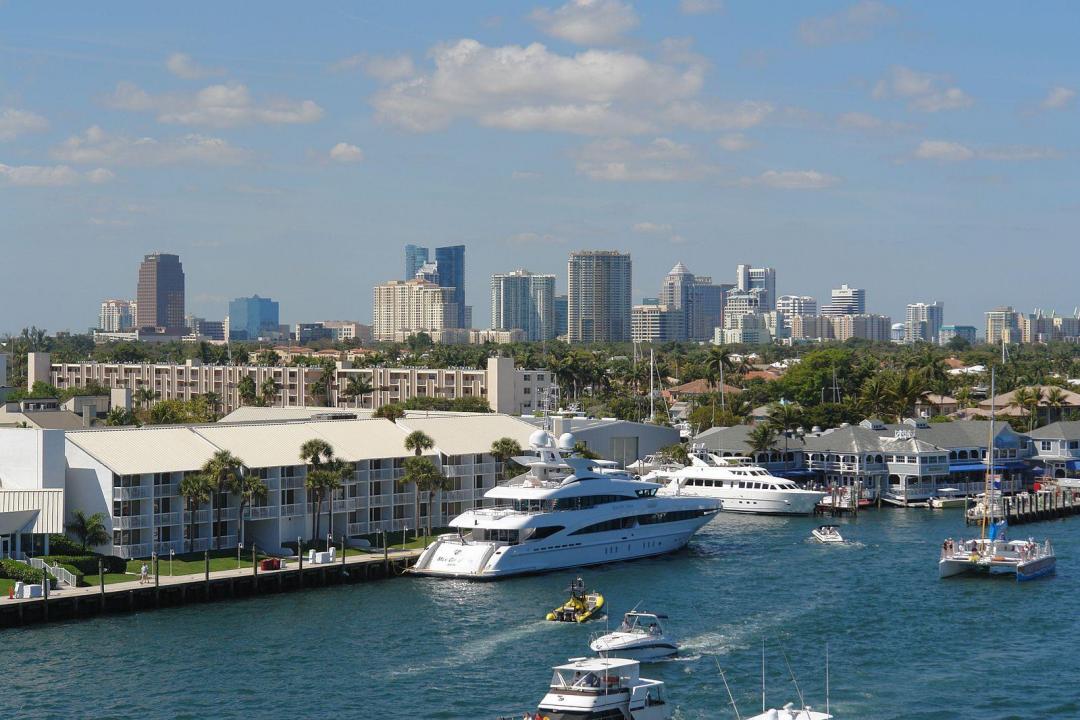
Kolossos // Wikimedia Commons
#24. Miami-Fort Lauderdale-Pompano Beach, FL Metro Area
– Migration to Miami in 2015-2019: 2,531
– Migration from Miami to Los Angeles: 2,586 (#14 most common destination from Miami)
– Net migration: 55 to Los Angeles
David Jordan // Wikicommons
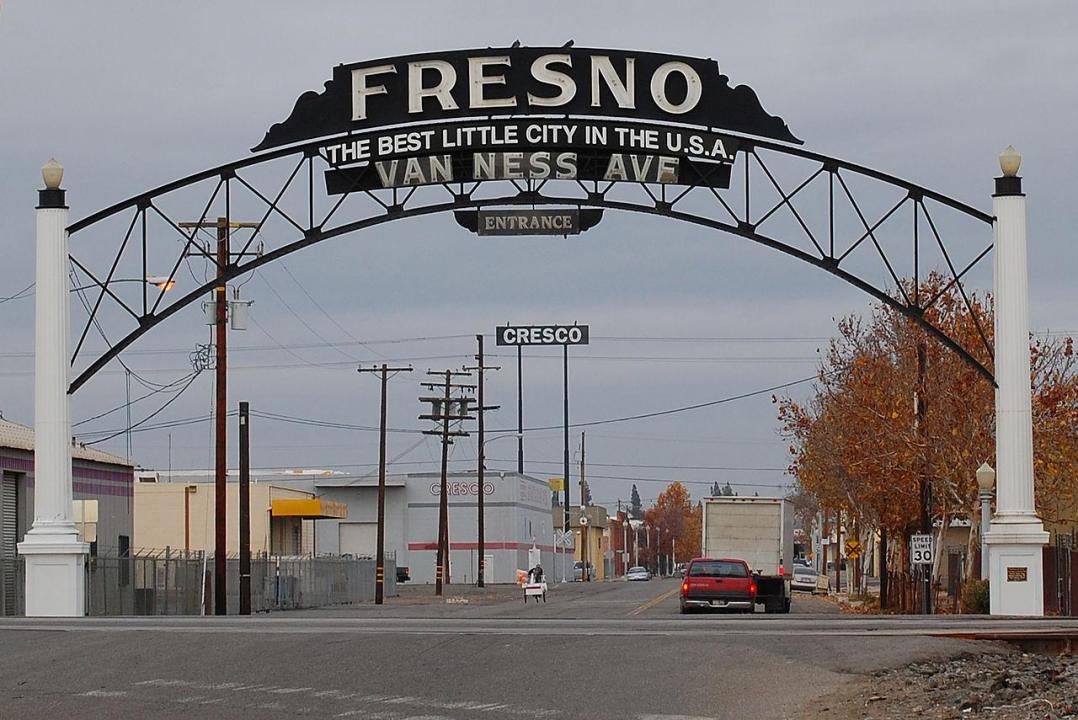
#23. Fresno, CA Metro Area
– Migration to Fresno in 2015-2019: 2,647
– Migration from Fresno to Los Angeles: 2,228 (#1 most common destination from Fresno)
– Net migration: 419 to Fresno
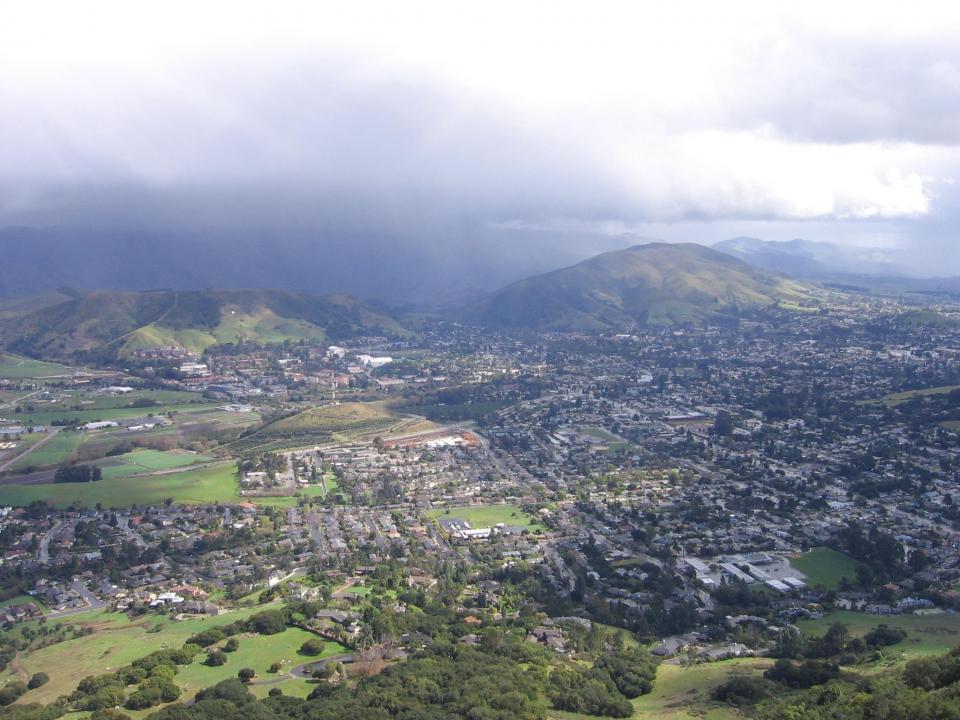
Basar // Wikicommons
#22. San Luis Obispo-Paso Robles, CA Metro Area
– Migration to San Luis Obispo in 2015-2019: 3,093
– Migration from San Luis Obispo to Los Angeles: 1,296 (#2 most common destination from San Luis Obispo)
– Net migration: 1,797 to San Luis Obispo

Sean Pavone // Shutterstock
#21. Boston-Cambridge-Newton, MA-NH Metro Area
– Migration to Boston in 2015-2019: 3,372
– Migration from Boston to Los Angeles: 4,575 (#8 most common destination from Boston)
– Net migration: 1,203 to Los Angeles
You may also like: Most expensive homes for sale in Los Angeles

Keizers // Wikimedia Commons
#20. Atlanta-Sandy Springs-Alpharetta, GA Metro Area
– Migration to Atlanta in 2015-2019: 3,537
– Migration from Atlanta to Los Angeles: 3,002 (#14 most common destination from Atlanta)
– Net migration: 535 to Atlanta

Pixabay
#19. Austin-Round Rock-Georgetown, TX Metro Area
– Migration to Austin in 2015-2019: 3,849
– Migration from Austin to Los Angeles: 1,473 (#8 most common destination from Austin)
– Net migration: 2,376 to Austin

f11photo // Shutterstock
#18. Denver-Aurora-Lakewood, CO Metro Area
– Migration to Denver in 2015-2019: 4,347
– Migration from Denver to Los Angeles: 2,875 (#7 most common destination from Denver)
– Net migration: 1,472 to Denver

Andrew Bossi // Wikimedia
#17. Washington-Arlington-Alexandria, DC-VA-MD-WV Metro Area
– Migration to Washington in 2015-2019: 4,514
– Migration from Washington to Los Angeles: 5,093 (#7 most common destination from Washington)
– Net migration: 579 to Los Angeles
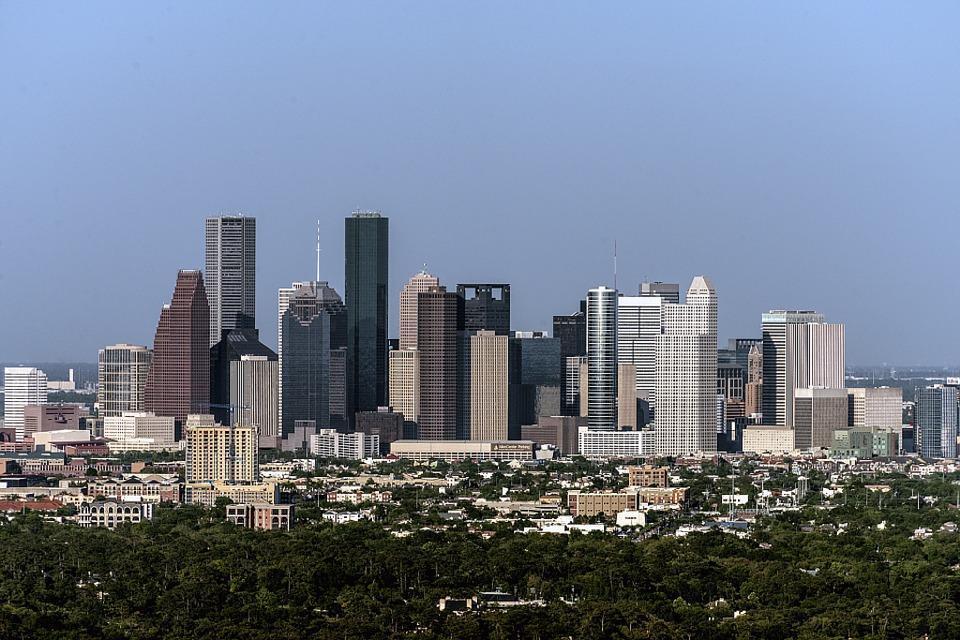
skeeze // Pixabay
#16. Houston-The Woodlands-Sugar Land, TX Metro Area
– Migration to Houston in 2015-2019: 4,601
– Migration from Houston to Los Angeles: 2,468 (#12 most common destination from Houston)
– Net migration: 2,133 to Houston
You may also like: Highest-rated cheap eats in Los Angeles, according to Tripadvisor

Christopher & Amy Esposito // Wikicommons
#15. Chicago-Naperville-Elgin, IL-IN-WI Metro Area
– Migration to Chicago in 2015-2019: 5,035
– Migration from Chicago to Los Angeles: 7,263 (#3 most common destination from Chicago)
– Net migration: 2,228 to Los Angeles

Stuart Seeger // Wikicommons
#14. Portland-Vancouver-Hillsboro, OR-WA Metro Area
– Migration to Portland in 2015-2019: 5,101
– Migration from Portland to Los Angeles: 2,300 (#8 most common destination from Portland)
– Net migration: 2,801 to Portland
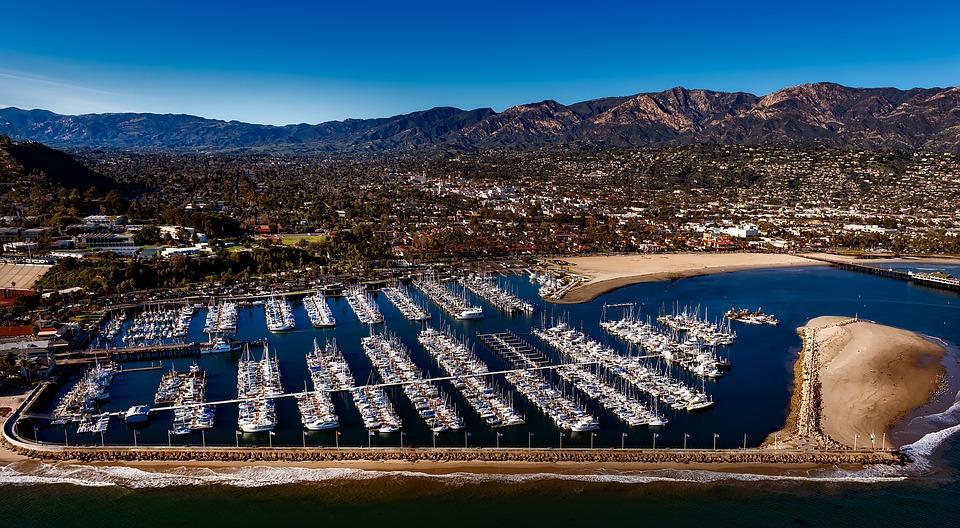
Pixabay
#13. Santa Maria-Santa Barbara, CA Metro Area
– Migration to Santa Maria in 2015-2019: 5,424
– Migration from Santa Maria to Los Angeles: 2,727 (#1 most common destination from Santa Maria)
– Net migration: 2,697 to Santa Maria
Don Ramey Logan // Wikicommons
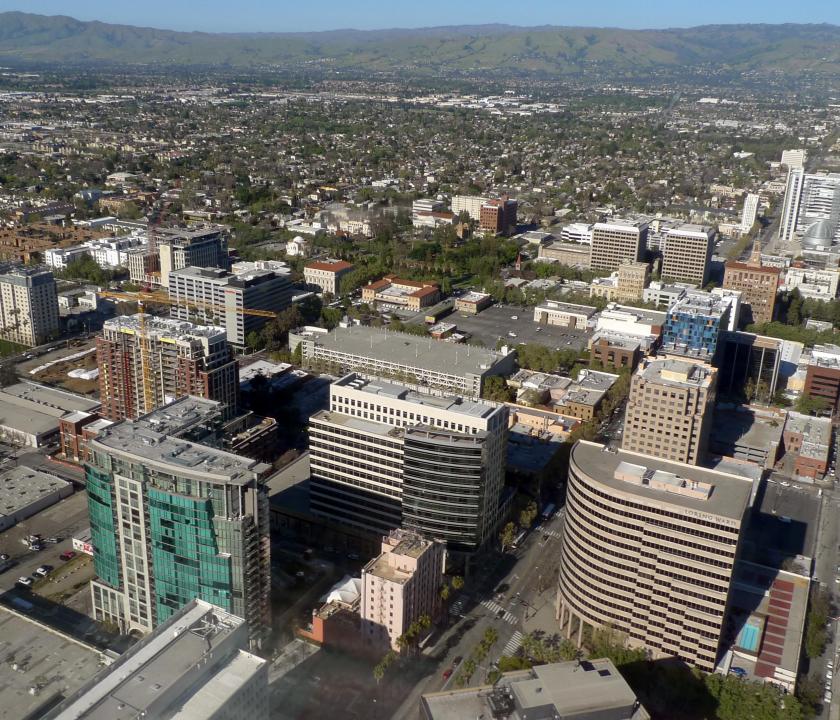
#12. San Jose-Sunnyvale-Santa Clara, CA Metro Area
– Migration to San Jose in 2015-2019: 7,229
– Migration from San Jose to Los Angeles: 6,353 (#2 most common destination from San Jose)
– Net migration: 876 to San Jose
Public Domain
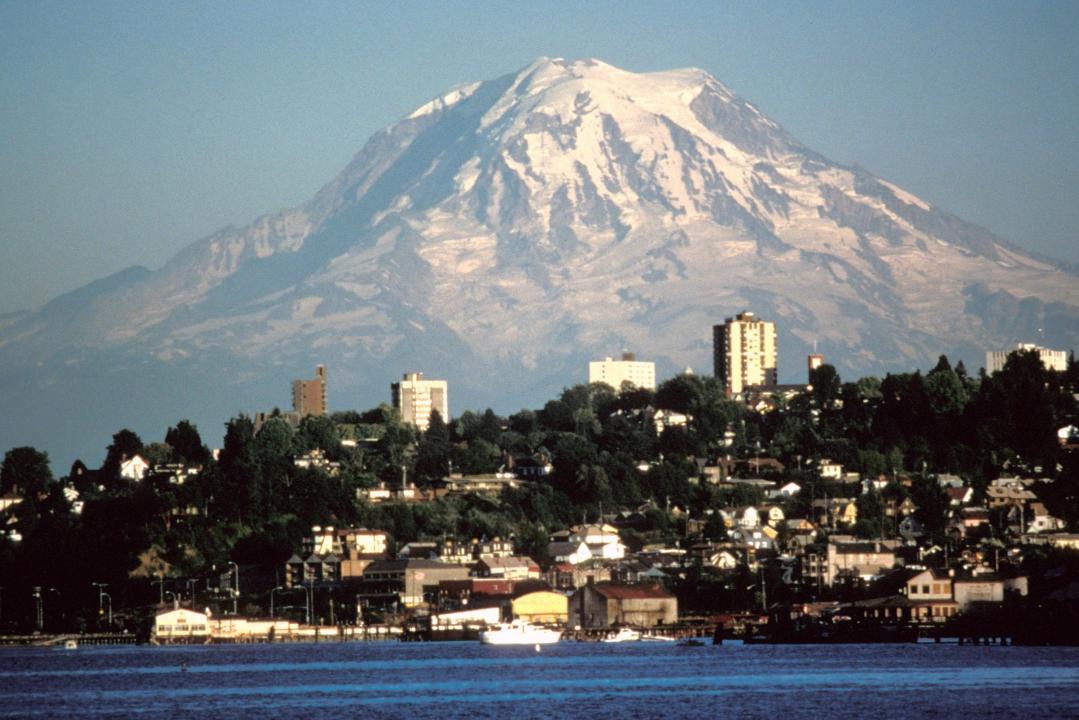
#11. Seattle-Tacoma-Bellevue, WA Metro Area
– Migration to Seattle in 2015-2019: 8,677
– Migration from Seattle to Los Angeles: 5,600 (#5 most common destination from Seattle)
– Net migration: 3,077 to Seattle
You may also like: People from these metros are finding new jobs in Los Angeles

King of Hearts // Wikimedia
#10. New York-Newark-Jersey City, NY-NJ-PA Metro Area
– Migration to New York in 2015-2019: 8,912
– Migration from New York to Los Angeles: 15,451 (#4 most common destination from New York)
– Net migration: 6,539 to Los Angeles

Pixabay
#9. Sacramento-Roseville-Folsom, CA Metro Area
– Migration to Sacramento in 2015-2019: 10,033
– Migration from Sacramento to Los Angeles: 4,958 (#2 most common destination from Sacramento)
– Net migration: 5,075 to Sacramento

Alan Botting // Wikimedia Commons
#8. Dallas-Fort Worth-Arlington, TX Metro Area
– Migration to Dallas in 2015-2019: 10,312
– Migration from Dallas to Los Angeles: 4,496 (#6 most common destination from Dallas)
– Net migration: 5,816 to Dallas
CameronK23 // Wikimedia Commons
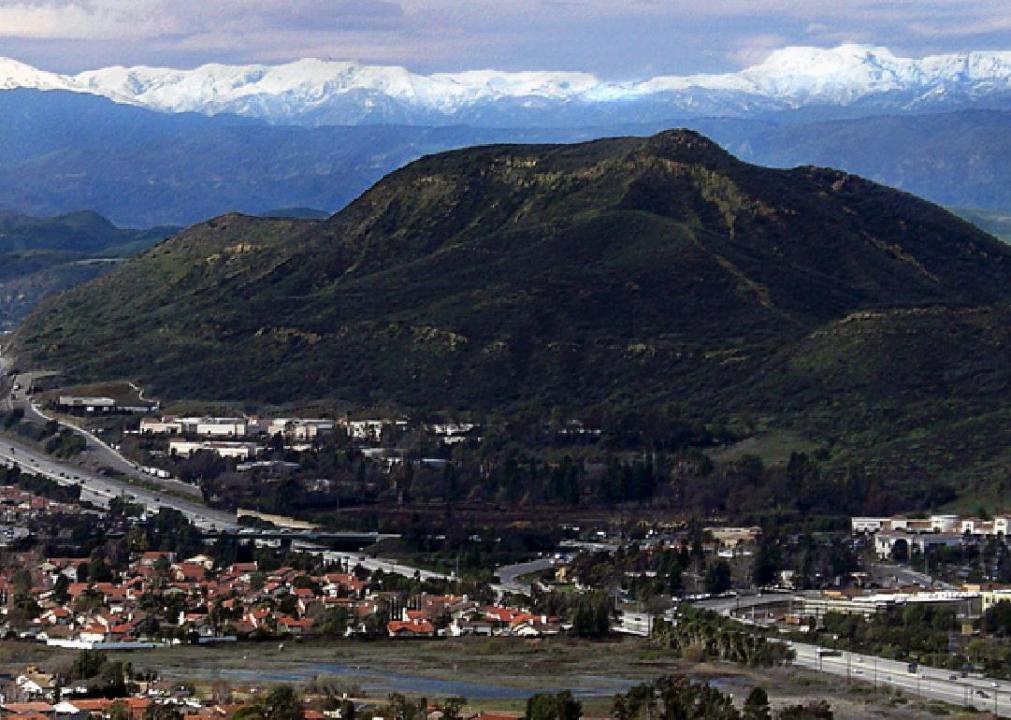
#7. Oxnard-Thousand Oaks-Ventura, CA Metro Area
– Migration to Oxnard in 2015-2019: 10,514
– Migration from Oxnard to Los Angeles: 8,342 (#1 most common destination from Oxnard)
– Net migration: 2,172 to Oxnard

nickchapman // Wikicommons
#6. Bakersfield, CA Metro Area
– Migration to Bakersfield in 2015-2019: 11,077
– Migration from Bakersfield to Los Angeles: 4,769 (#1 most common destination from Bakersfield)
– Net migration: 6,308 to Bakersfield
You may also like: Highest-paying jobs in Los Angeles that don’t require a college degree

DPPed// Wikimedia
#5. Phoenix-Mesa-Chandler, AZ Metro Area
– Migration to Phoenix in 2015-2019: 13,273
– Migration from Phoenix to Los Angeles: 4,904 (#4 most common destination from Phoenix)
– Net migration: 8,369 to Phoenix

randy andy // Shutterstock
#4. Las Vegas-Henderson-Paradise, NV Metro Area
– Migration to Las Vegas in 2015-2019: 15,765
– Migration from Las Vegas to Los Angeles: 5,220 (#1 most common destination from Las Vegas)
– Net migration: 10,545 to Las Vegas

SD Dirk // Flickr
#3. San Diego-Chula Vista-Carlsbad, CA Metro Area
– Migration to San Diego in 2015-2019: 17,598
– Migration from San Diego to Los Angeles: 16,420 (#2 most common destination from San Diego)
– Net migration: 1,178 to San Diego
en:User:Paul.h // Wikimedia
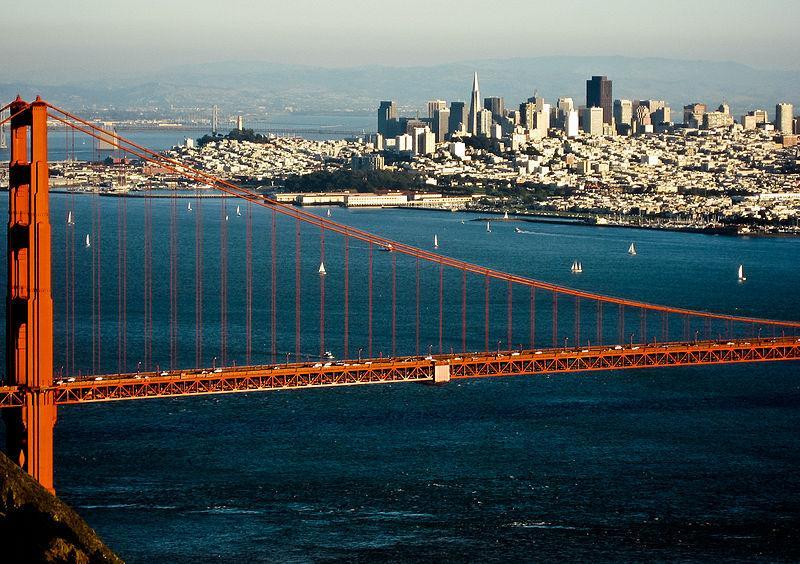
#2. San Francisco-Oakland-Berkeley, CA Metro Area
– Migration to San Francisco in 2015-2019: 19,738
– Migration from San Francisco to Los Angeles: 16,425 (#3 most common destination from San Francisco)
– Net migration: 3,313 to San Francisco
Daniel Orth // Flickr
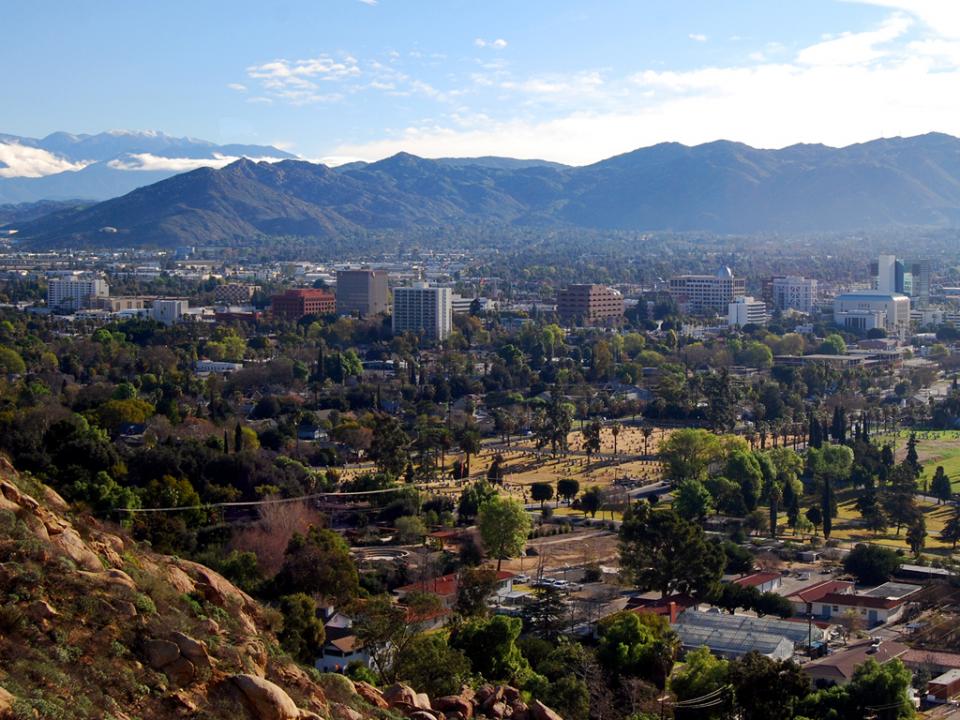
#1. Riverside-San Bernardino-Ontario, CA Metro Area
– Migration to Riverside in 2015-2019: 85,533
– Migration from Riverside to Los Angeles: 40,020 (#1 most common destination from Riverside)
– Net migration: 45,513 to Riverside
You may also like: Highest-rated Asian restaurants in Los Angeles, according to Tripadvisor