Show Your Stripes Day

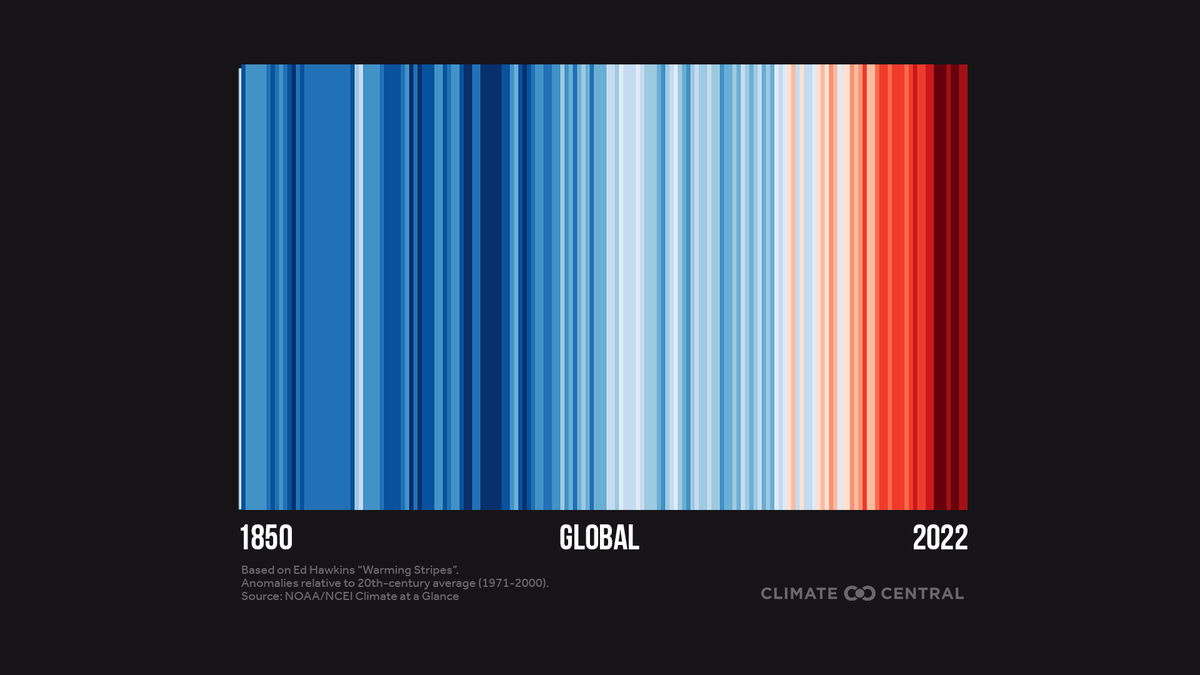
Today is #ShowYourStripes Day! You may have seen a graphic like the one(s) below before. It looks almost like a red and blue barcode. Just as barcodes can contain certain information, so do these diagrams provided by Climate Central. Instead of information about a specific product, however, these graphics show us trends in temperatures for a specific area.

Each bar represents the average temperature for each individual year. This annual average temperature is compared to the average temperature based on climatological data.
Just as a reminder, weather refers to the short term changes in atmospheric conditions whereas climate refers to the average weather conditions for a given area over a long period of time. If the average annual temperature for a given year differs from the climatological average (what atmospheric scientists would call an anomaly), it is assigned a color.
Blue colors indicate years with an anomalously cool temperatures and red colors indicate years with temperatures above the climatological average. The strength of the color reflects how anomalous that year's temperature was.

The trend of rising temperatures as a result of global warming is most clearly seen when looking at the diagram for the globe. It is highly evident that the planet is currently undergoing a strong warming trend. This is a direct result of global warming from increased greenhouse gasses in our atmosphere.

It's important to mention that there are many factors which impact a location's climate and average temperature. As a result, the diagrams for various regions or countries will look different. However, every diagram prominently displays a sharp trend of rising temperatures.
To learn more about Climate Central or explore graphics for other places across the globe, visit climatecentral.org.


